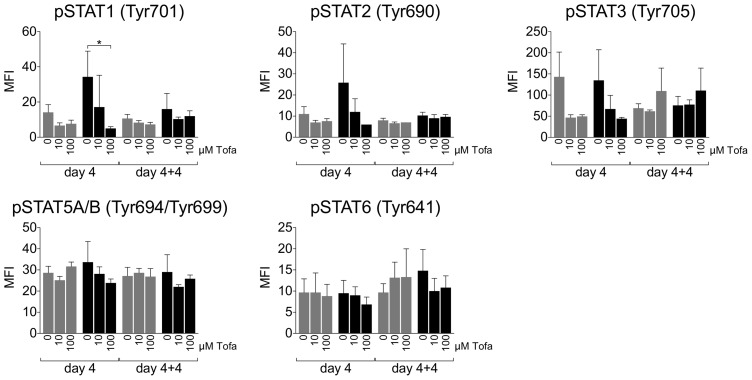
Figure 5. Phosphorylation profile of STAT proteins.
Phosphorylation profile of STAT1, STAT2, STAT3, STAT5A/B, STAT6 was evaluated by magnetic bead-based multiplex immunoassays. Data are expressed as Median Intensity Fluorescence (MFI) ± SD of three independent experiments. Grey bars: unstimulated cells; Black bars: PHA stimulated cells. Statistical significance was calculated using one-way analysis of variance (ANOVA) and Bonferroni post-test. *p<0.05.

