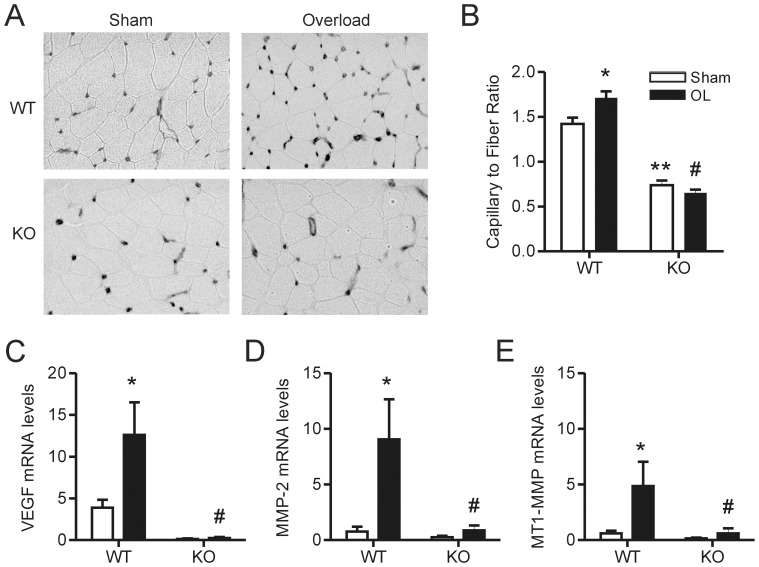
Figure 1. Muscle overload-induced angiogenesis is attenuated in muscle VEGF KO animals.
Representative inverted grey-scale images of iso-lectin staining (A) were used to calculate the capillary to muscle fiber ratio (n = 10 for WT Sham, n = 4 for KO Sham, n = 7 for WT OL and n = 5 for KO OL) (B). Muscle subjected to overload for 7 days was lysed for qPCR analysis of VEGF (C), MMP-2 (D) and MT1-MMP (E) transcript levels (n = 4 for WT Sham, KO Sham and KO OL and n = 3 for WT OL). Values are presented as mean ± SEM. There was a significant main effect of overload on the capillary to fiber ratio as well as VEGF, MMP-2 and MT1-MMP transcript levels, as assessed by two way ANOVA (*). Bonferroni’s multiple comparison posthoc tests revealed a significant difference between the capillary to fiber ratio of KO sham animals compared WT sham animals (**) and a significant difference in the capillary to fiber ratio and VEGF, MMP-2 and MT1-MMP transcript levels in KO overload animals compared to WT overload animals (#). WT – wildtype, KO – knockout and OL – overload.

