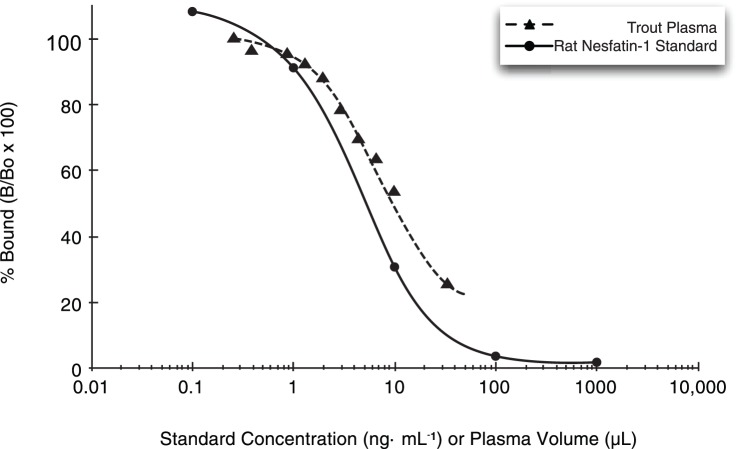
Figure 1. Parallel displacement of rat nesfatin-1 by a serial dilution of trout plasma.
Displacement curve showing parallelism of the rat nesfatin-1 standard curve (circle points, solid line) and a dilution series of female rainbow trout plasma displacing rat-nesfatin-1 (triangle points, dashed line) in the nesfatin-1 EIA. Horizontal axis depicts volume of trout plasma (µL) used in the assay or concentration of rat-nesfatin-1 standard (ng⋅mL−1).

