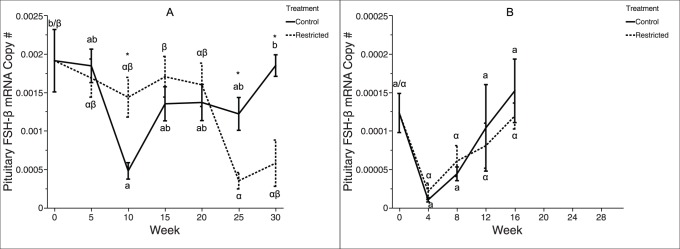
Figure 5. Pituitary fsh-β mRNA expression in female rainbow trout recovering from spawning.

Mean (±SEM) normalized ratio of pituitary fsh-β to β-actin mRNA levels over time in female rainbow trout (A: two-year-old; B: three-year-old) fed a control-ration or restricted-ration. See Figure 2 for an explanation of what each symbol signifies. Figure A: n = 6 per treatment at all time points. Figure B: n = 5 per treatment at all time points.
