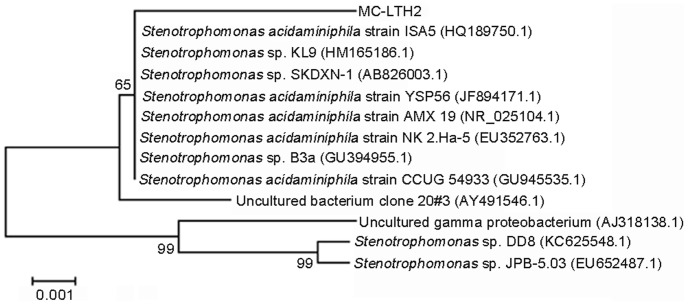
Figure 1. A phylogenetic tree based on 16S rDNA sequences of MC-LTH2 and other closely related species.
The numbers at the nodes are the levels of bootstrap support (%) based on the neighbor-joining analyses of 1,000 resampled datasets. The scale bar represents 0.001 nucleotide substitutions per position.

