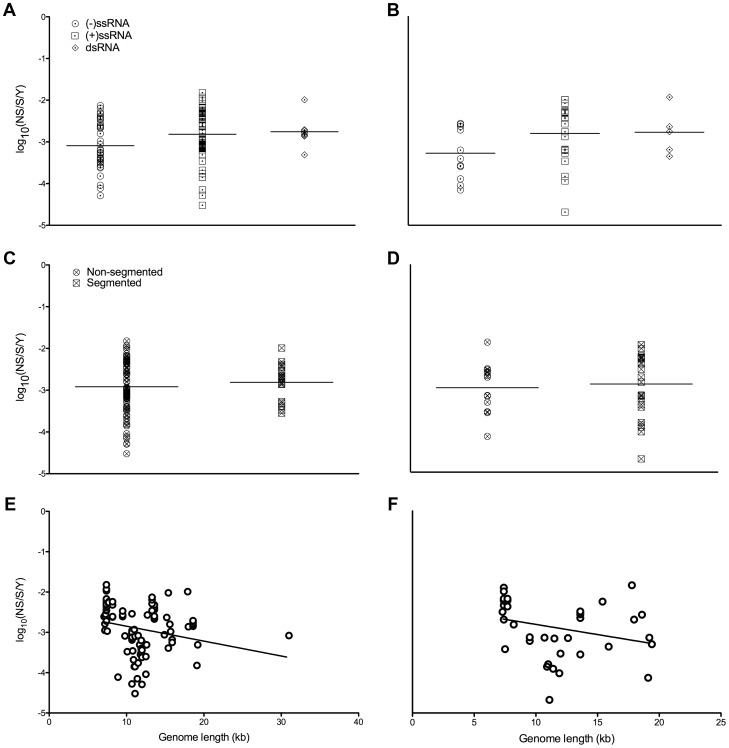
Figure 2. Nucleotide substitution rates and genomic properties of mammalian RNA viruses.
Log scale mean substitution rate (log10(nucleotide substitutions/site/year, NS/S/Y)) estimates for different genomic architectures (sense/strandedness, A and B, and whether or not the genome is segmented, C and D) and plotted against genome lengths (E and F). The plots on the left show rates based on structural genes, while the plots on the right show those of non-structural genes. Each black bar in A–D indicates the mean of each level, and the levels of each of these variables are sorted by increasing mean substitution rate. The line of best fit is shown in E and F. The coefficients of determination (R 2) for the linear regression models of genome lengths vs. substitution rates were 0.06 for the structural gene dataset and 0.08 for the non-structural gene dataset. Sources of the rates are given in Table S1.

