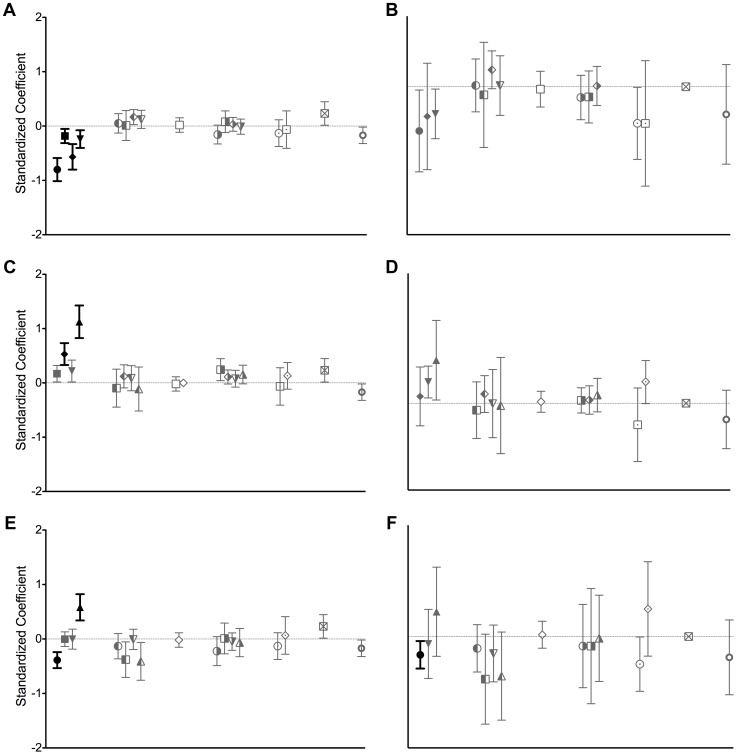
Figure 3. Standardized coefficients for predictors of viral substitution rates.
Standardized coefficients with 95% confidence intervals for the different predictor variables of structural (left) and non-structural (right) gene substitution rates. A and B show the coefficients from the first ANCOVA analysis, C and D show coefficients from the second ANCOVA analysis, and E and F show coefficients from the third ANCOVA analysis. Coefficients are indicated by the same symbols used in Figures 1 and 2. Dark coefficients correspond to significant substitution rate predictors (P<0.01: neural, leukocyte, hepatocyte, and epithelial target cells in A, leukocyte and epithelial target cells in C, neural and epithelial target cells in E, and neural target cells in F), while the other coefficients are shown in gray.

