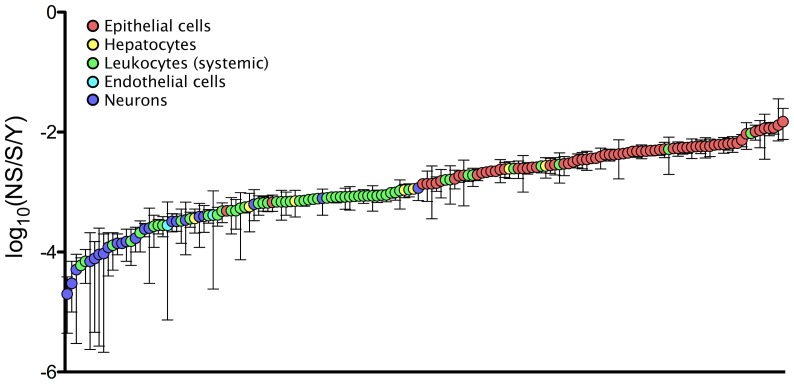
Figure 4. Nucleotide substitution rates and principle target cells of mammalian RNA viruses.
Log scale mean nucleotide substitution rates (log10(nucleotide substitutions per site per year, NS/S/Y)) of all RNA viruses included in this study with 95% credibility intervals. Credibility intervals that are not visible are eclipsed by the symbol or, in three cases (NoV GII.b, HEV, and TBEV), were not available from the published source. Sources of the rates are given in Table S1.

