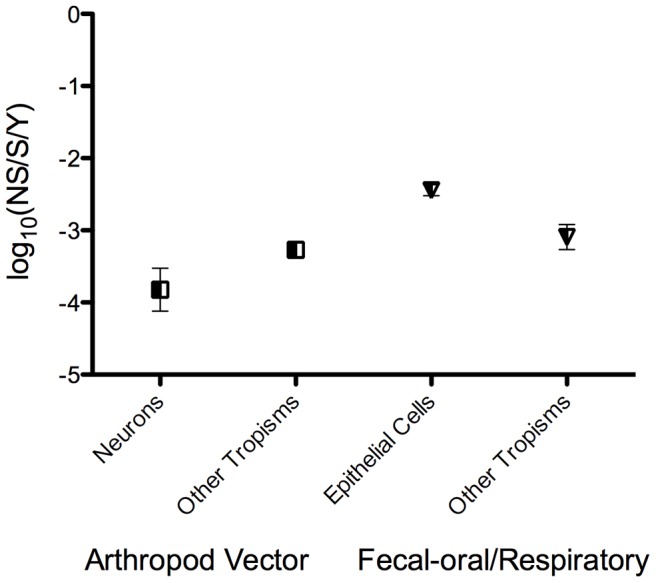
Figure 5. Nucleotide substitution rate variation among arboviruses and fecal-oral/respiratory transmitted viruses with different cell tropisms.

The means of the log-scale mean nucleotide substitution rates of neurotopic (n = 13) and non-neurotropic (n = 38) arboviruses are shown as squares on the left, and the means of the log-scale mean nucleotide substitution rates of viruses that are transmitted through the fecal-oral/respiratory routes and primarily target epithelial cells (n = 73) and those that are transmitted through the fecal-oral/respiratory routes and primarily target other cells (n = 15) are shown as the triangles on the right. The mean of each group is shown with 95% confidence intervals (CIs), except for non-neurotropic arboviruses, where the CIs are eclipsed by the symbol.
