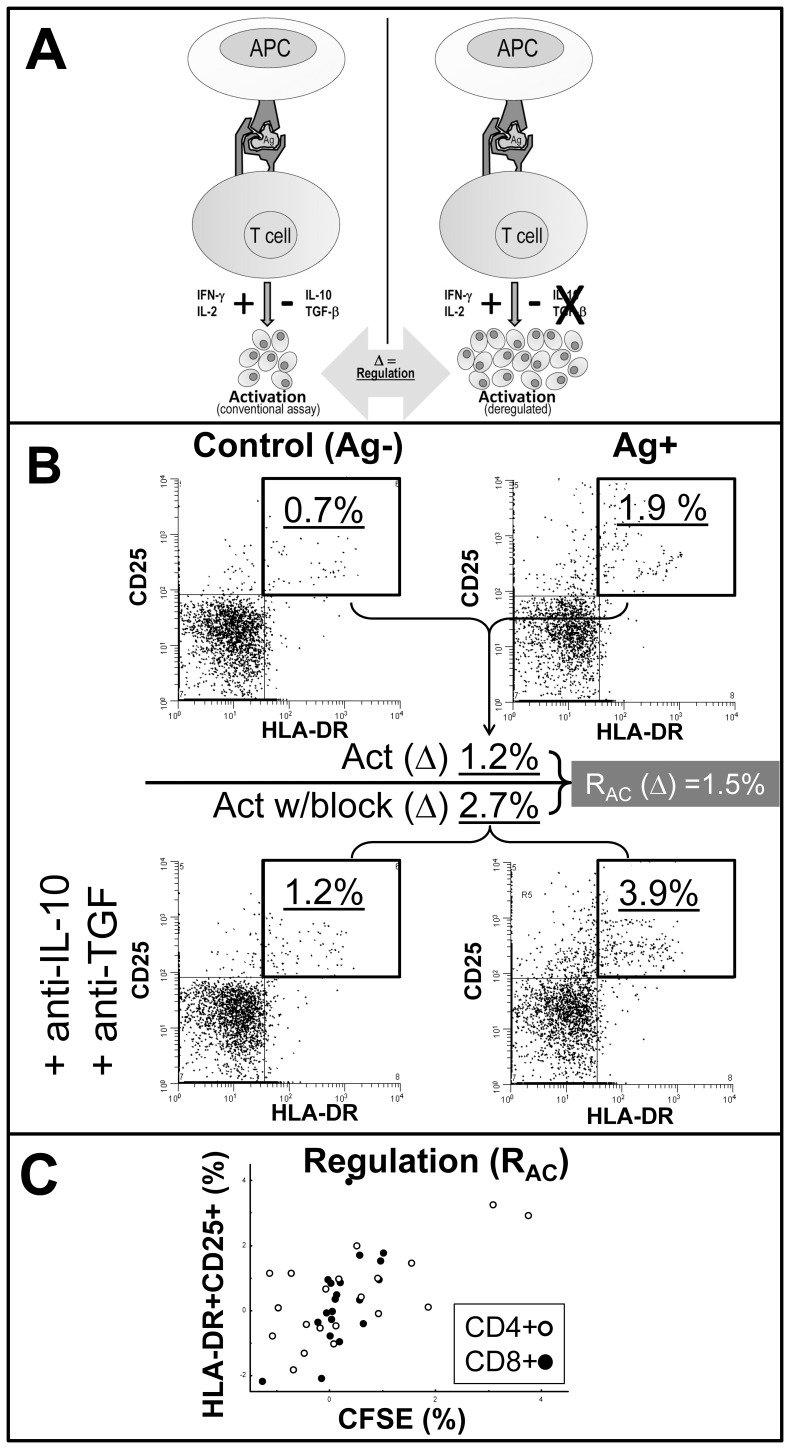
Figure 2. Schematic outline and examples of the T cell regulation assay.
A. Schematic outline of the assay measuring antigen-induced cytokine-mediated induced regulation (RAC) of T cell activation by IL-10 and TGF-ß. Left panel shows a conventional T cell assay where the final activation measurements are regarded as net results of proinflammatory and regulatory signals. Right panel show a possible outcome when blocking T cell regulatory cytokines. T cell regulation (Δ) is here defined as the difference in activation responses to the same antigen between these panels. B. Detailed example calculating classical activation (upper panels) and regulation (calculated from activation in the presence blocking mAbs to IL-10 and TGF, lower panels), all gated for viable CD8+ CD3+ T cells. Activation in both upper and lower panels calculated as the difference (Δ) in CD25+HLA-DR+ fractions between control and antigen-stimulated (Ag+). Note a typical slight increase in background activation (lower left panel). Regulation (RAC) calculated as the difference (Δ) between activation in cytokine-blocked culture and conventional activation culture. C. Scatter plots of regulation calculated in the same cultures by CFSEdim or HLA-DR+CD25+, respectively, for the CD8+ (λ, r = 0.67, p<0.001) and CD4+ (Υ, r = 0.45, p = 0.026) T cell subsets.

