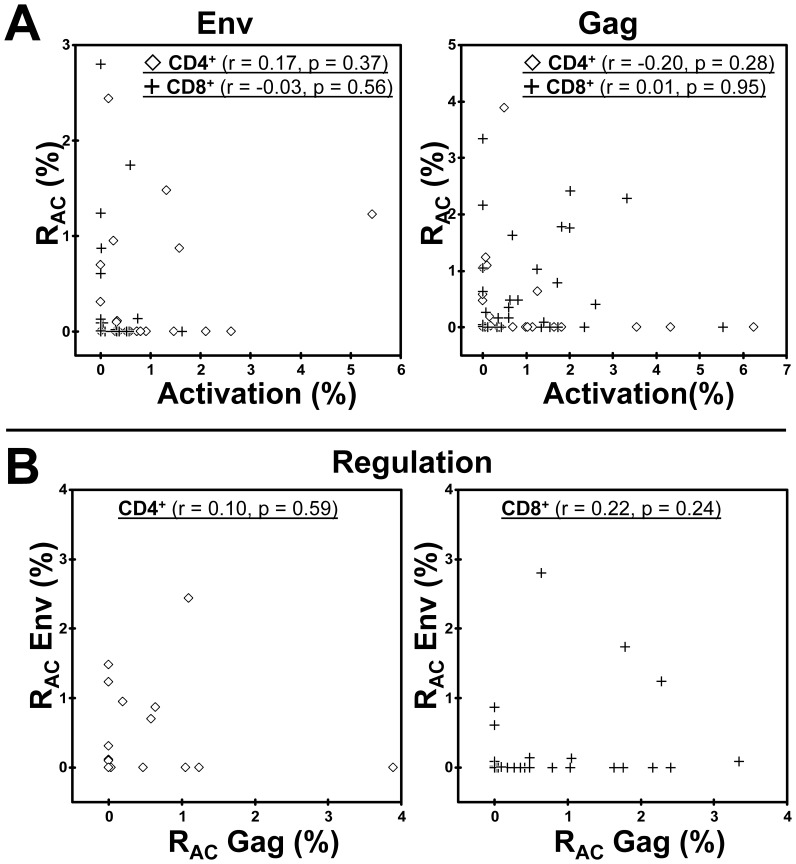
Figure 3. Insignificant relations between T cell activation and RAC induced by Env and Gag peptide panels.
A. Relations between regulation and activation to Env (left panels) and Gag (right panels) within the CD4+ and CD8+ T cell subsets respectively, correlation coefficients indicated. B. Relations between Env- and Gag-induced regulation within the CD4+ (right panel) and the CD8+ (right panel) T cell subsets, respectively, correlation coefficients indicated.

