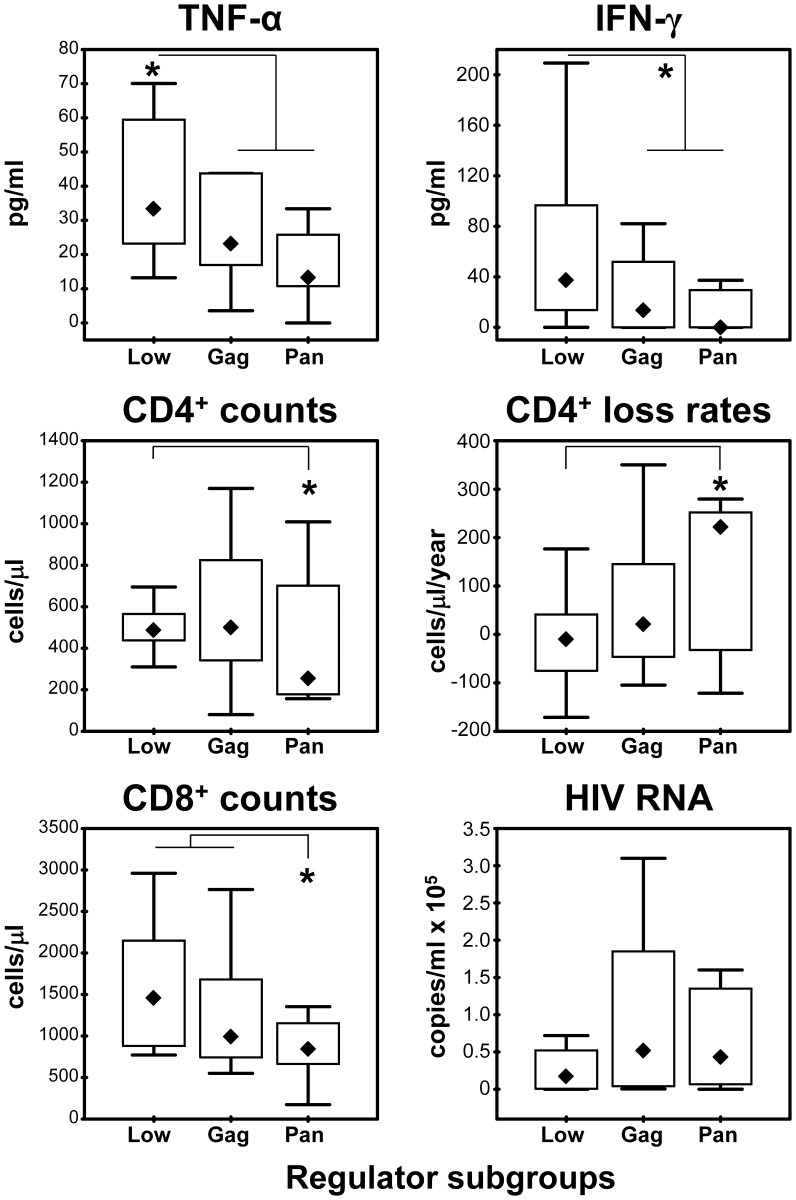
Figure 6. Distributions between regulator subgroups.
Box and whisker plots representing medians, interquartile ranges and overall ranges for cytokines in snap-frozen plasma (upper two panels), CD4 counts and CD4 loss rates (two middle panels) and CD8 counts as well as HIV RNA levels (two lower panels). “Low regulators” (Low) as defined in the text are represented as one group, whereas the “High regulator” patients are split into “Gag regulators” (Gag) and “Pan regulators” (Pan), respectively. Significant differences p<0.05 between groups (Mann-Whitney) indicated (*).

