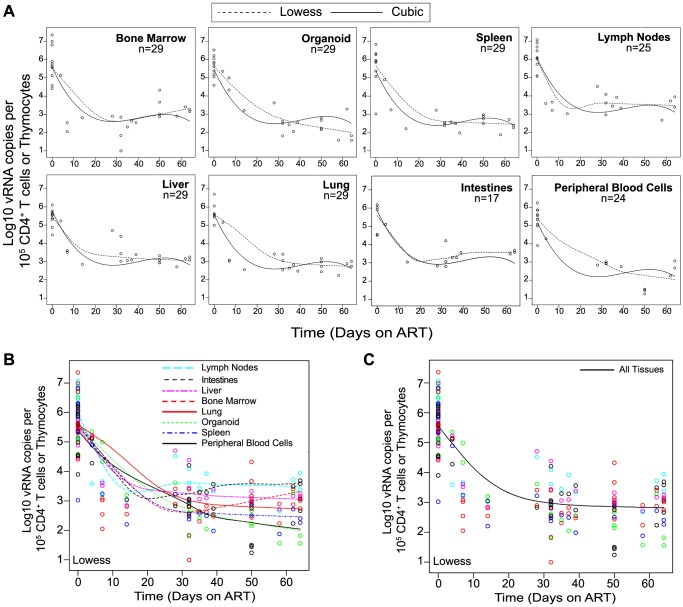
Figure 3. Viral RNA production during ART rapidly declines and then enters a plateau phase in all tissues.
(A) Each data point indicates cell-associated vRNA levels (y-axis) and the days following ART initiation (x-axis) for a given BLT mouse in the indicated tissues. Both Lowess (dashed line) and a cubic (solid line) regression models were fit to the data for each tissue. (B) To facilitate comparative analyses between tissues, all of the Lowess regressions are graphed together. (C) To determine the overall impact of ART on systemic cell-associated vRNA levels, data from all of the tissues was used to generate a single Lowess curve.

