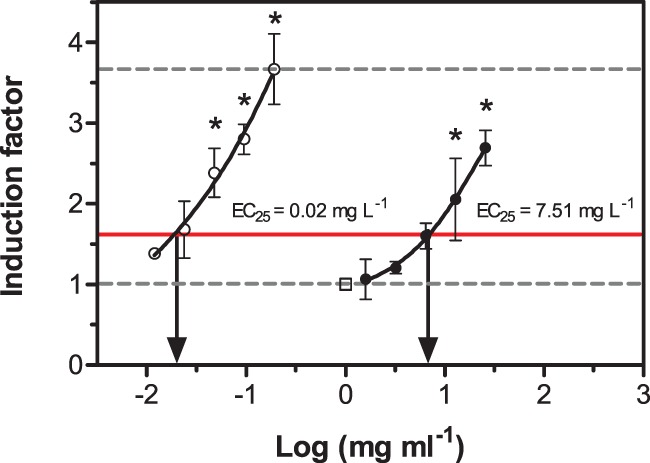
Figure 2. Exemplary concentration-response curve (carbazole) measured in the micronucleus assay with RTL-W1 cells (closed circles).

The concentration-response curve for NQO (open circles) and the blanks, i.e. control cells without treatment (open square and lower dashed line), are given for reference. Induction factors are fold-changes relative to blanks. EC25 values relative to the maximum induction of NQO (upper dashed line) were calculated to derive fixed-effect-level-based REPs. Concentration values on the x-axis refer to nominal medium concentrations of the substances. Circles represent mean values measured in duplicate experiments, error bars the standard deviation. The red line depicts 25% of the maximum induction caused by the standard NQO. Asterisks denote statistically significant differences compared to blanks (one-way ANOVA with Dunnet’s test, p≤0.05).
