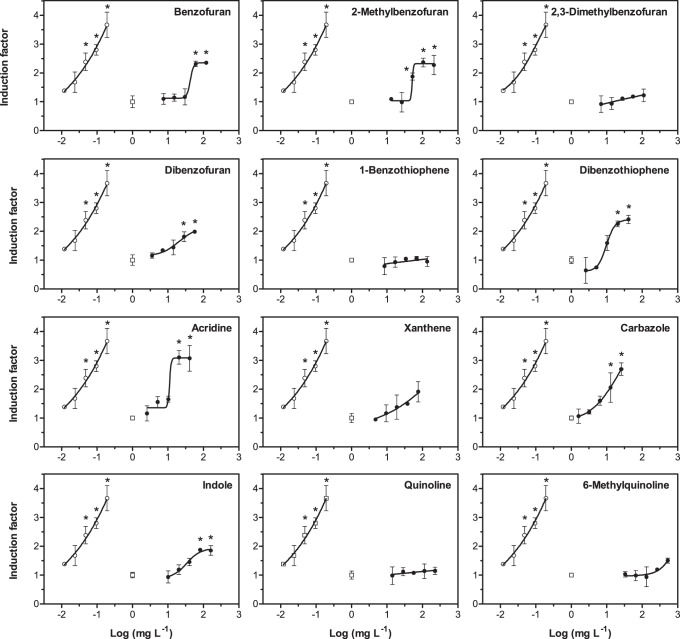
Figure 4. Dose-response curves in the micronucleus assay with RTL-W1 cells for all investigated heterocyclic compounds (closed circles).
Standard curves for NQO (open circles) and blanks, i.e. control cells without treatment (open squares, grey line), are given for reference. Induction factors are fold-changes relative to blanks. Concentration values on the x-axis refer to nominal medium concentrations of the substances. Dots represent mean values measured in duplicate experiments, error bars the standard deviation. Asterisks denote statistically significant differences compared to blanks (one-way ANOVA with Dunnet’s test, p≤0.05).

