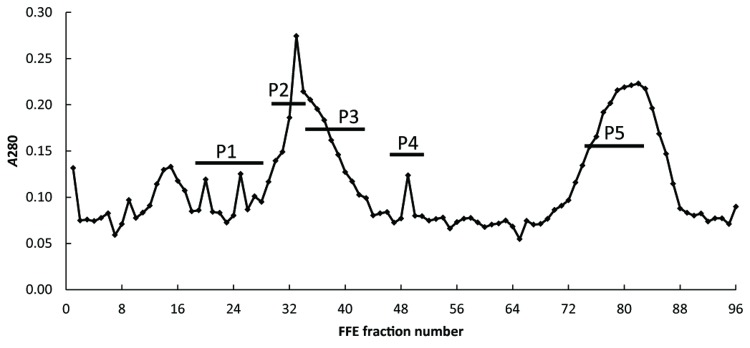
Figure 1. Post-FFE protein profile of enriched Golgi membrane preparations from strong compression wood (sCW) of developing pine xylem.

FFE separated samples are distributed into 96-wellplates and protein distribution can be monitored by absorbance (A280 nm). The post-FFE profile for both the mCW and sCW samples derived from the 0.75/1.0 M interface had similar profiles. The FFE fractions were pooled as follows: P1; fractions 16 to 30, P2; fractions 31 to 33, P3; fractions 34 to 40, P4; fractions 48 to 50 and P5; fractions 72 to 80. CW-P1 to P5 were concentrated and analyzed for GalS activity (Table S5 in File S1).
