FIGURE 2.
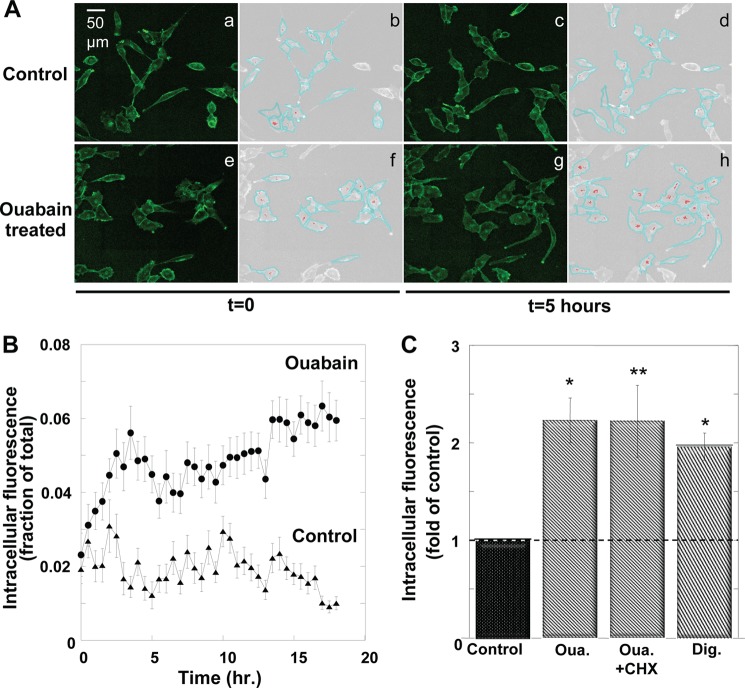
Ouabain induced internalization of the Na+/K+-ATPase. A, representative confocal (a, c, e, and g) and computer-assisted segmented (b, d, f, and h) images of YFP-α1 H1299 cells. Cells received either 100 nm ouabain or diluent (t = 0). Images were taken at t = 0 and 5 h later and processed as described under “Experimental Procedures.” YFP fluorescence was segmented to membrane (cyan) and internal (red) regions. a and b, untreated cells at t = 0. c and d, untreated cells, t = 5 h. e and f, cells treated with 100 nm ouabain, t = 0. g and h, cells treated with 100 nm ouabain, t = 5 h. B, time course of YFP-α1 internalization. Intracellular fluorescence was quantified at 30-min intervals following the application of 100 nm ouabain (t = 0). Intracellular fluorescence is expressed as the fraction of the total cell fluorescence and averaged over all the cells in the imaged field. Means ± S.E. (error bars) of 20–40 cells are depicted. C, cells were treated with 100 nm ouabain or digoxin. One batch of cells received 100 μg/ml CHX prior to the addition of ouabain. Plateau values of intracellular α1-YFP were determined at t >4 h and normalized to values in control cells that receive diluent. Means ± S.E. of three different experiments are depicted. *, p < 0.005; **, p < 0.02.

