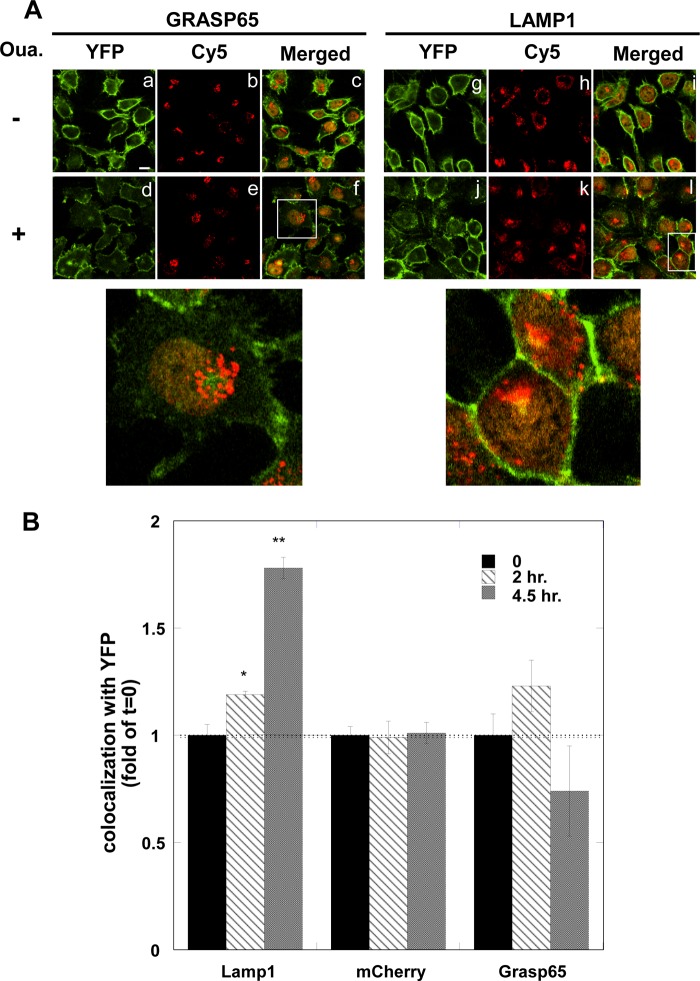
FIGURE 5.
Co-localization of YFP-α1 and lysosomal marker. A, top, cell monolayers were incubated for 4.5 h with (d–f, j–l) and without (a–c, g–i) 100 nm ouabain and stained for the lysosome and Golgi markers LAMP1 (g–l) and GRASP65 (a–f). Images were acquired using Olympus FV1000 confocal scanning microscope at ×60 magnification. Green, YFP-α1; red, LAMP1 or GRASP65. Bottom, enlargements show the areas marked by squares in images f and l. B, quantification of the colocalization of YFP-α1 and various intracellular markers is shown. The amount of α1 in the nucleus, lysosome and Golgi has been determined by colocalization of the YFP signal with that obtained from mCherry, LAMP1, and GRASP65, respectively. Means ± S.E. (error bars) of data from five to nine FOVs imaged 0, 2, and 4.5 h after the application of ouabain are depicted. *, p < 0.02; **, p < 0.005.

