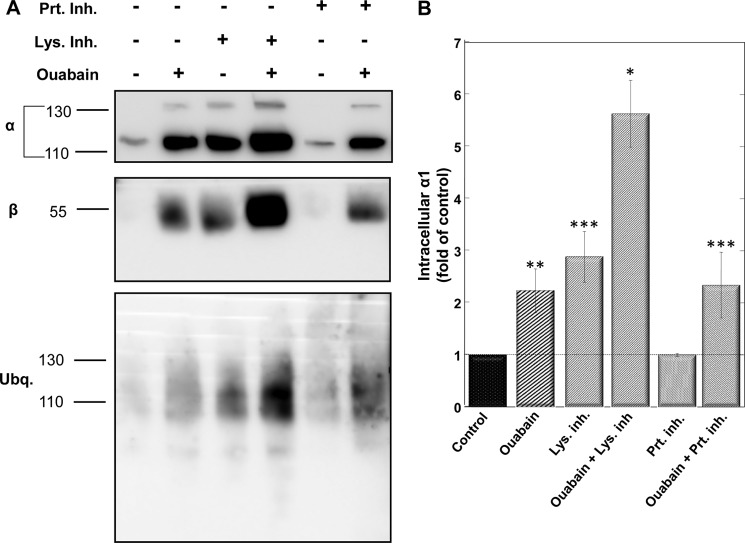
FIGURE 6.
Effects of lysosomal and proteosomal inhibitors on the intracellular pool of α1. A, plates of confluent monolayers of H1299 were surface-biotinylated and then incubated for 7 h ± 100 nm ouabain and either lysosomal inhibitors (20 μg/ml leupeptin, 10 nm chloroquine, and 20 mm NH4Cl) or proteosomal inhibitor (2.5 μm bortezomib). Internalized proteins were isolated on streptavidin beads, resolved electrophoretically, and blotted with antibodies to α- and β-Na+/K+-ATPase and ubiquitin. B, quantification of biotinylated (internalized) α1 is shown. Means ± S.E. (error bars) of three to five experiments using the above procedure are averaged. *, p < 0.0005; **, p < 0.002; ***, p < 0.05.

