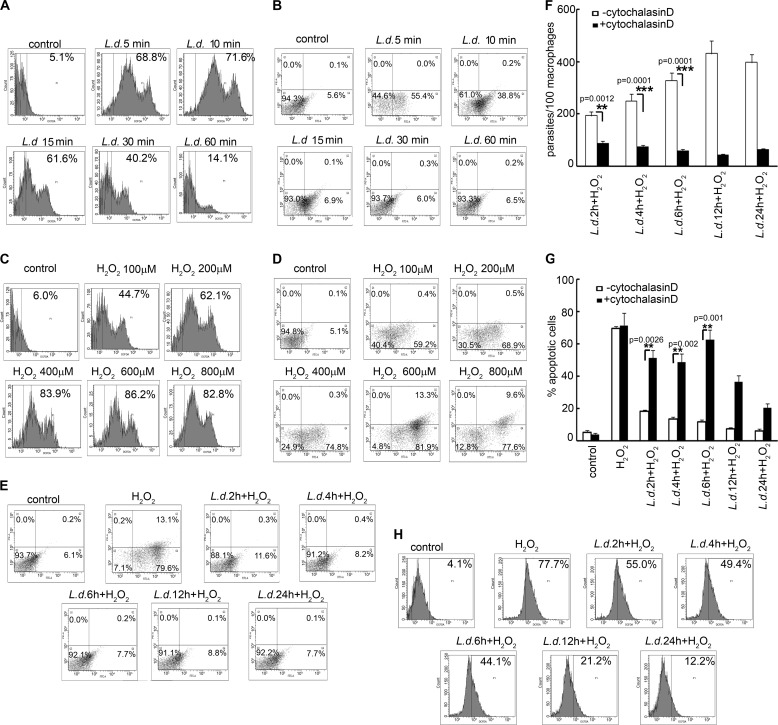
FIGURE 1.
Effect of L. donovani infection on macrophage ROS generation and apoptosis. A, C, and H, macrophages were either infected with L. donovani (L.d.) promastigotes with a parasite/macrophage ratio of 10:1 for the indicated time periods (A) or treated with various concentrations of H2O2 for 1 h (C) or infected with promastigotes followed by treatment with H2O2 (400 μm) for 1 h (H). Cells were washed, and ROS generation was measured by H2DCFDA staining followed by flow cytometric analysis. The H2DCFDA-positive cells are indicated as the percentage of gated cells. B, D, and E, macrophages were either infected with L. donovani promastigotes (B) or treated with various concentrations of H2O2 for 1 h (D) or infected with promastigotes followed by treatment with H2O2 (400 μm) for 1 h (E). Cells were washed and incubated overnight at 37 °C, and the extent of apoptosis was analyzed by annexin V-tagged FITC-PI flow cytometry. Dual parameter dot plot of FITC fluorescence (x axis) versus PI fluorescence (y axis) is represented as logarithmic fluorescence intensity. Quadrants are as follows: upper left, necrotic cells; lower left, live cells; lower right, apoptotic cells; upper right, necrotic or late phase of apoptotic cells. F and G, control or cytochalasin D (2 μm)-pretreated RAW 264.7 cells were infected with L. donovani promastigotes for different time periods as indicated. The number of parasites per 100 macrophages was evaluated by Giemsa staining (F), and apoptosis was quantified by flow cytometry (G). Results are representative of three individual experiments, and the error bars represent mean ± S.D. (n = 3). **, p < 0.01; ***, p < 0.001 by Student's t test.

