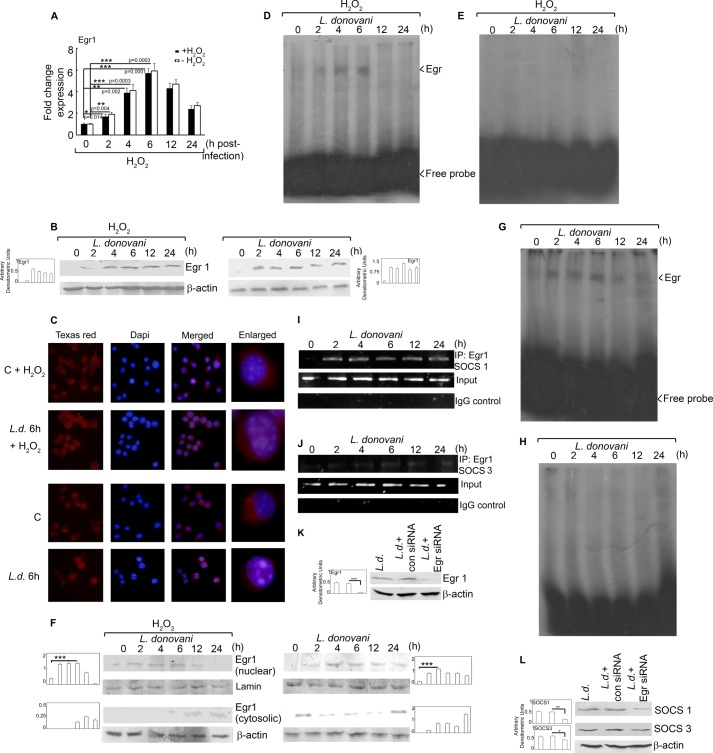
FIGURE 4.
Transcriptional regulation of SOCS proteins. Macrophages were infected with L. donovani for the indicated time periods. One group of infected macrophages from each time point was subjected to H2O2 treatment for 1 h. A and B, Egr1 expression was determined at the mRNA level (A) and protein level (B) by real time PCR and Western blotting respectively. C, cells were stained with anti-Egr1 monoclonal antibody followed by secondary Texas Red-conjugated antibody. Nuclei were stained with DAPI, and cells were analyzed under fluorescence microscope. D, E, G, and H, labeled Egr1 probe (D and G) or Egr1 probe with a mutated binding site (E and H) was incubated with nuclear extracts prepared from cells treated as above. DNA binding was analyzed by EMSA. F, cells were treated as above; nuclear and cytosolic extracts were prepared, and expression of Egr1 was analyzed by immunoblotting. I and J, cells were infected with L. donovani for the indicated time periods and analyzed for Egr1 ChIP assay. PCR amplification of anti-Egr1 immunoprecipitates (IP) and total input chromatin are shown in the upper and lower panels, respectively. K and L, macrophages were transfected (24 h) with either control or Egr1 siRNA followed by infection with L. donovani promastigotes for 6 h. Expression of Egr1 (K) and SOCS1 and SOCS3 (L) was evaluated by immunoblot analysis. Results are representative of three individual experiments, and the error bars represent mean ± S.D. (n = 3). *, p < 0.05; **, p < 0.01; ***, p < 0.001 by Student's t test.

