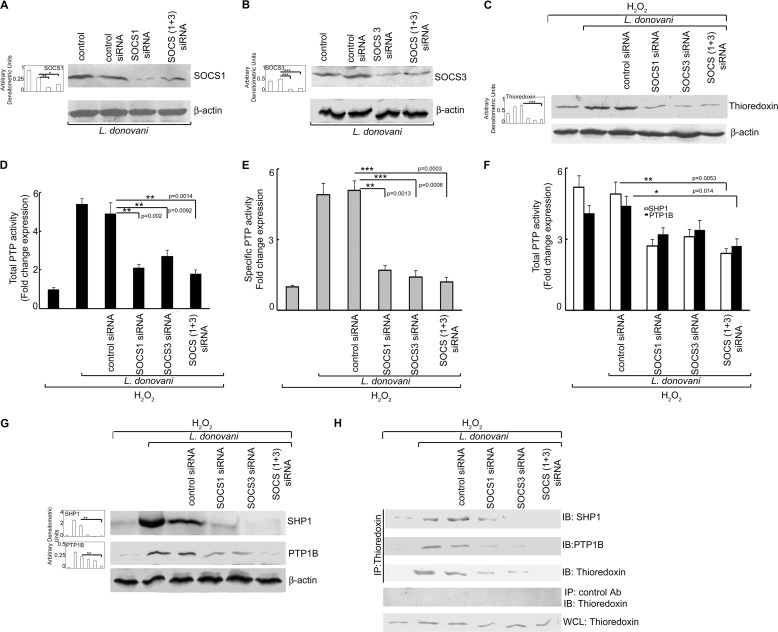
FIGURE 5.
Effect of knockdown of SOCS on macrophage PTP activity and caspase cascade. A and B, RAW 264.7 macrophages were transfected (24 h) with either control or SOCS1 and/or SOCS3 siRNA followed by infection with L. donovani promastigotes for 6 h. Expression of SOCS1 (A) and SOCS3 (B) was evaluated by immunoblot analysis. C and G, expression of thioredoxin (C) and SHP-1 and PTP1B (G) was measured by Western blotting. D and E, total and specific PTP activities were evaluated by the capacity of cell lysates to hydrolyze pNPP (D) or a synthetic tyrosine phosphopeptide (E). Absorbance values were taken at 405 and 620 nm, respectively. F, SHP-1 and PTP-1B activities were evaluated by the capacity of immunoprecipitated phosphatases to hydrolyze pNPP. Absorbance value was taken at 405 nm. Results are expressed as the relative increase (n-fold) over PTP activity in control cells. H, cells were processed as in A followed by immunoprecipitation with thioredoxin antibody and immunoblotting with indicated antibodies. 30 μg of each sample was loaded as a whole cell lysate input control. IP, immunoprecipitation using the indicated antibody; IB, immunoblot analysis using the indicated antibody; WCL, whole cell lysate. Results are representative of three individual experiments, and the error bars represent mean ± S.D. (n = 3). *, p < 0.05; **, p < 0.01; ***, p < 0.001 by Student's t test.

