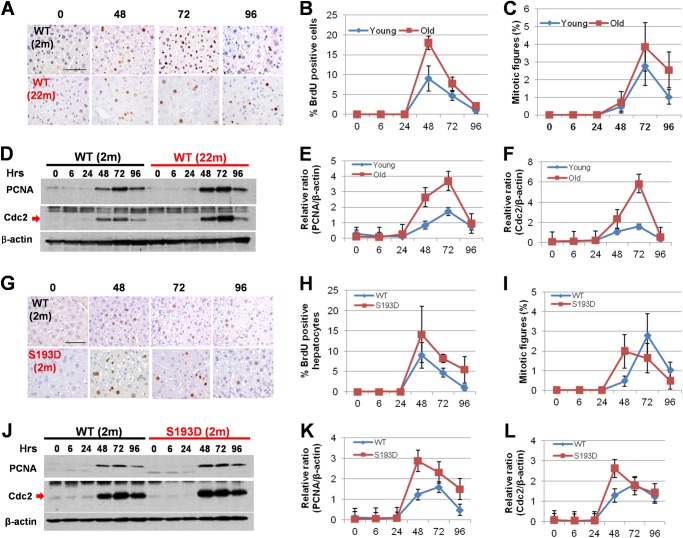
FIGURE 2.
Old WT mice and young S193D mice have increased hepatocyte proliferation after CCl4 treatment. A, examination of DNA replication in hepatocytes by BrdU uptake. B, number of BrdU-positive hepatocytes was counted and presented as percentage of total number of examined hepatocytes. C, examination of mitotic figures in young and old mice after CCl4 treatment. The number of mitotic figures was calculated as number per >1,000 hepatocytes. D, expression of PCNA and cdc2 was examined using Western blotting assay. E and F, bar graphs show the levels of these proteins as ratios to β-actin. G, examination of DNA replication in hepatocytes by BrdU uptake. Scale bar, 100 μm. H, number of BrdU-positive hepatocytes was calculated as percentage to the total number of hepatocytes. I, mitotic figures were calculated as number per >1,000 examined hepatocytes. J, expression of PCNA and cdc2 was examined using Western blotting. The filter was re-probed with Abs to β-actin. K and L, levels of PCNA and cdc2 were calculated as ratios to β-actin.

