
FIGURE 2.
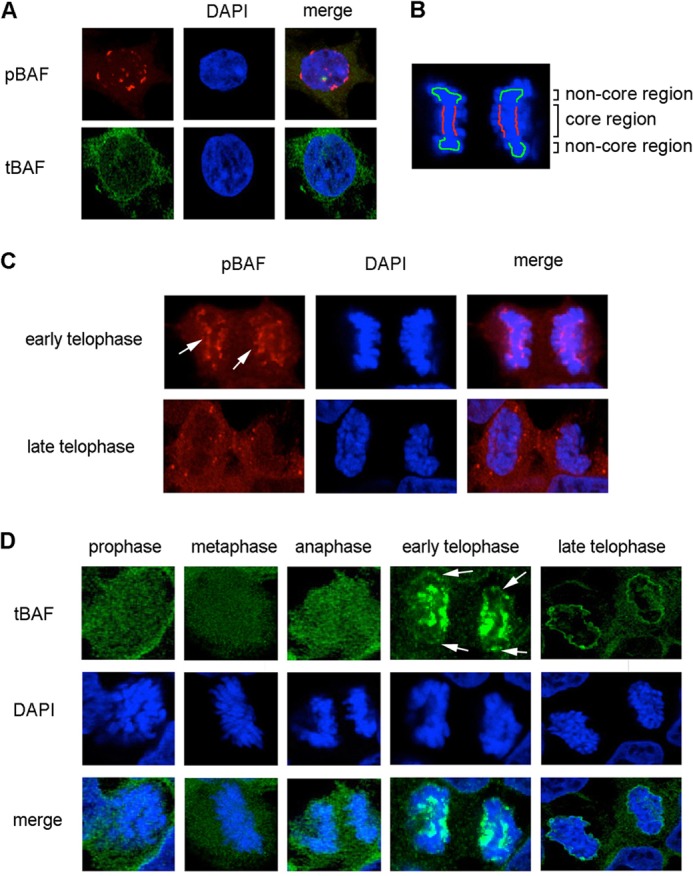
Localization of pBAF and tBAF through cell mitosis. A, HEK293 cells at interphase were immunostained with pBAF and tBAF antibodies. DAPI was used to stain the nucleus. B, schematic diagram of the core region and non-core region of early telophase chromosomes. The core region is indicated in red, and the non-core region is colored green. C, HEK293 cells at telophase were fixed and stained with the pBAF antibody and DAPI (DNA). Arrows indicate the signal at the core region. D, HEK293 cells during mitosis were stained with tBAF and DAPI. Arrows indicate the signal at the non-core region. Images were taken with a confocal microscope.