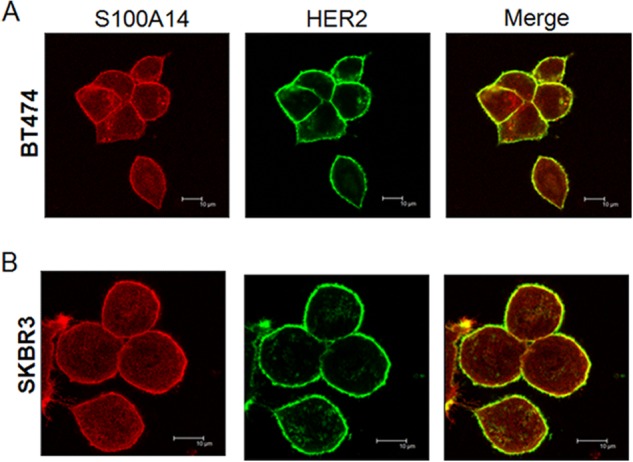
FIGURE 2.

Confocal analysis showing the colocalization of HER2 and S100A14 in BT474 (A) and SK-BR3 (B) cells. Cells were stained with HER2 antibody (green) or S100A14 (red). Merged images are shown on the right. Representative cells are shown in the confocal micrographs. Bars, 10 μm.
