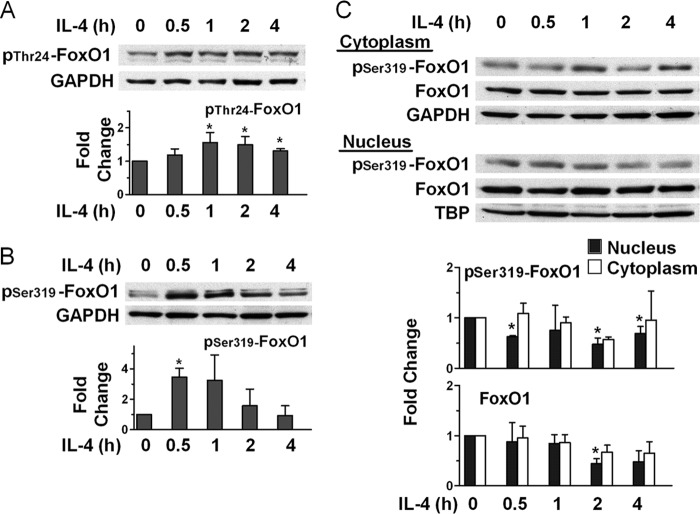
FIGURE 4.
IL-4 induces phosphorylation of FoxO1 and changes its cellular location. A and B, ECs were incubated with 10 ng/ml IL-4 for the times indicated and subjected to immunoblot analysis. Bars represent ratios of band density of pThr-24-FoxO1 (A) and pSer-319-FoxO1 (B) to that of GAPDH loading control and are means ± S.E. of four experiments in A and three experiments in B. C, IL-4 promotes nuclear exclusion of pSer-319-FoxO1 and FoxO1. ECs were incubated with 10 ng/ml IL-4 for the times indicated, and cytoplasmic and nuclear fractions were subjected to immunoblotting. Bars represent ratios of normalized densities for each fraction using the corresponding loading control, GAPDH and TATA-binding protein (TBP) for cytoplasmic and nuclear fraction, respectively, and are means ± S.E. of three experiments. *, p < 0.05, IL-4-treated versus time 0.

