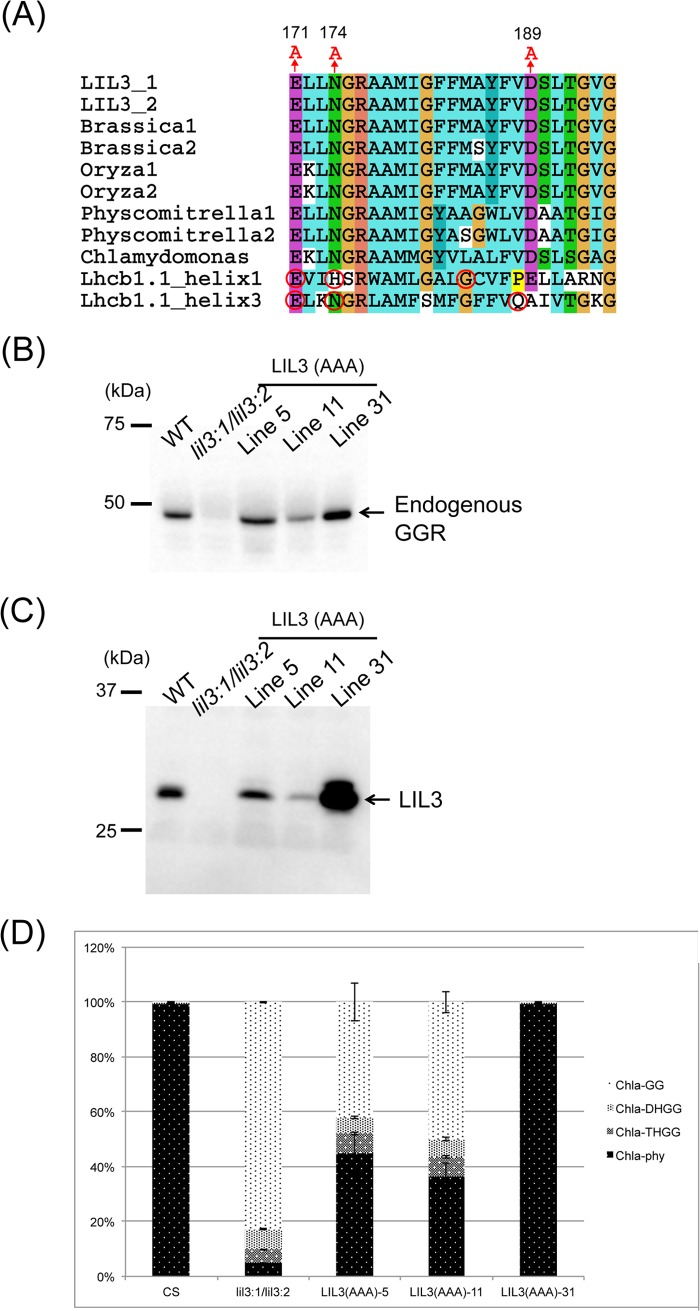
FIGURE 8.
A, amino acid alignment of representative LIL3 and LHC sequences. The numbers above the alignment indicate the amino acid positions in the Arabidopsis LIL3:2 sequence. Chlorophyll-binding ligands in helices 1 and 3 of Lhcb1 are shown with red circles. B, immunoblot analysis of GGR levels in three independent LIL3(AAA)-expressing lines. C, immunoblot analysis of LIL3(AAA) levels in three independent LIL3(AAA)-expressing lines. D, the compositions of Chl a derivatives in the LIL3(AAA) lines. Error bars represent S.D. n = 4.

