Figure 1.
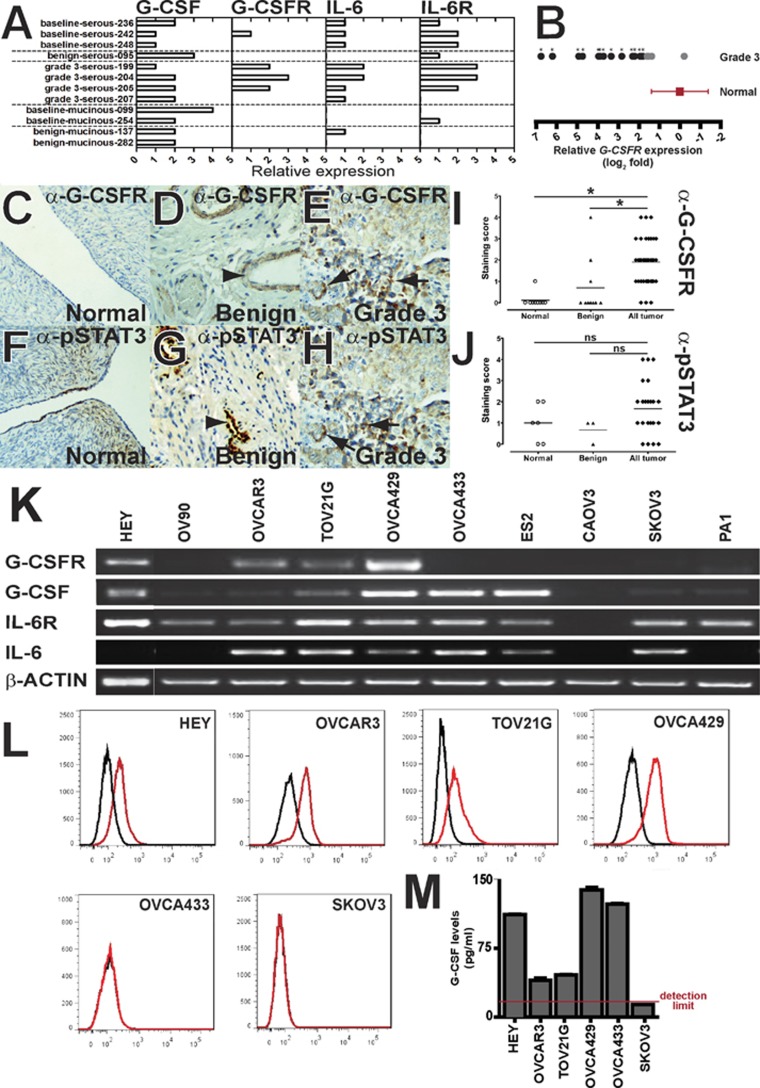
Expression of G-CSF/G-CSFR in ovarian cancer. (A–B) Expression of G-CSF/G-CSFR in primary ovarian cancers. RNA derived from the indicated patient samples were analysed with primers specific for G-CSF, G-CSFR, IL-6, IL-6R and β-ACTIN as a control. This analysis used either semi-quantitative RT–PCR with expression of G-CSF, G-CSFR, IL-6 and IL-6R scored on a five-point scale on the indicated tumour samples (A), or by qRT–PCR for G-CSFR relative to β-ACTIN on Grades 3 tumour samples (B). (C–J) Detection of G-CSFR and phospho-STAT3 in ovarian cancer. Immunohistochemical staining of normal ovary (C, F), benign tumour (D, G) or Grade 3 (E, H) tumour samples with anti-G-CSFR (C–E) or anti-pSTAT3 (F-H), as indicated. Arrows indicate scattered epithelial staining with both antibodies in Grade 3 tumours, and arrowheads indicate vessel-associated staining. Immunohistochemical staining with anti-G-CSFR or anti-pSTAT3 was scored on a scale of 0–5, and represented as a scatter-plot for normal ovary, benign and pooled tumour groups, with the level of statistical significance indicated (I–J, *P<0.05, ns: not significant). (K–M) Expression of G-CSF/G-CSFR in a panel of ovarian cancer cell lines. Cells were analysed by RT–PCR for expression of the indicated genes (K), subjected to FACS analysis using anti-G-CSFR-PE (red line) or an isotype control (black line) (L), or conditioned media obtained and analysed for G-CSF by ELISA (M).

