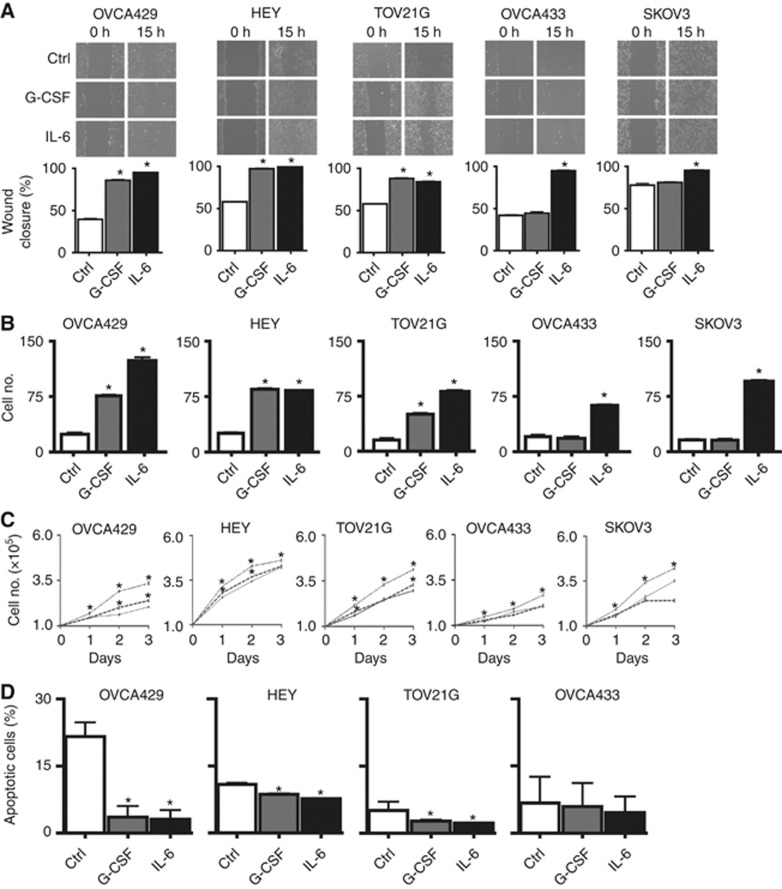
Figure 2.
Phenotypic effects of G-CSF on G-CSFR-positive ovarian cancer cells. (A) Wound-healing assay. Indicated cells were incubated in a medium lacking cytokines (Ctrl) or containing G-CSF (10 ng ml−1) or IL-6 (10 ng ml−1). Images are representative of single independent experiments performed in triplicate. Graphs represent the mean percentage area of wound closure from three independent experiments (*P<0.05). (B) Transwell migration assay. Indicated cells were analysed for migration in a transwell chamber in the presence and absence of G-CSF and IL-6. Mean number of cells migrated through the chamber was counted from five different areas from three independent experiments (*P<0.05). (C) Proliferation assay. Indicated cells were incubated over a period of 5 days in the presence and absence of G-CSF and IL-6. The graph represents the mean cell count of three independent experiments (*P<0.05). (D) Apoptosis assay. Indicated cells were treated with sodium azide alone (Ctrl) or in the presence of G-CSF and IL-6. Graph shows the mean percentage of apoptotic cells (*P<0.05).

