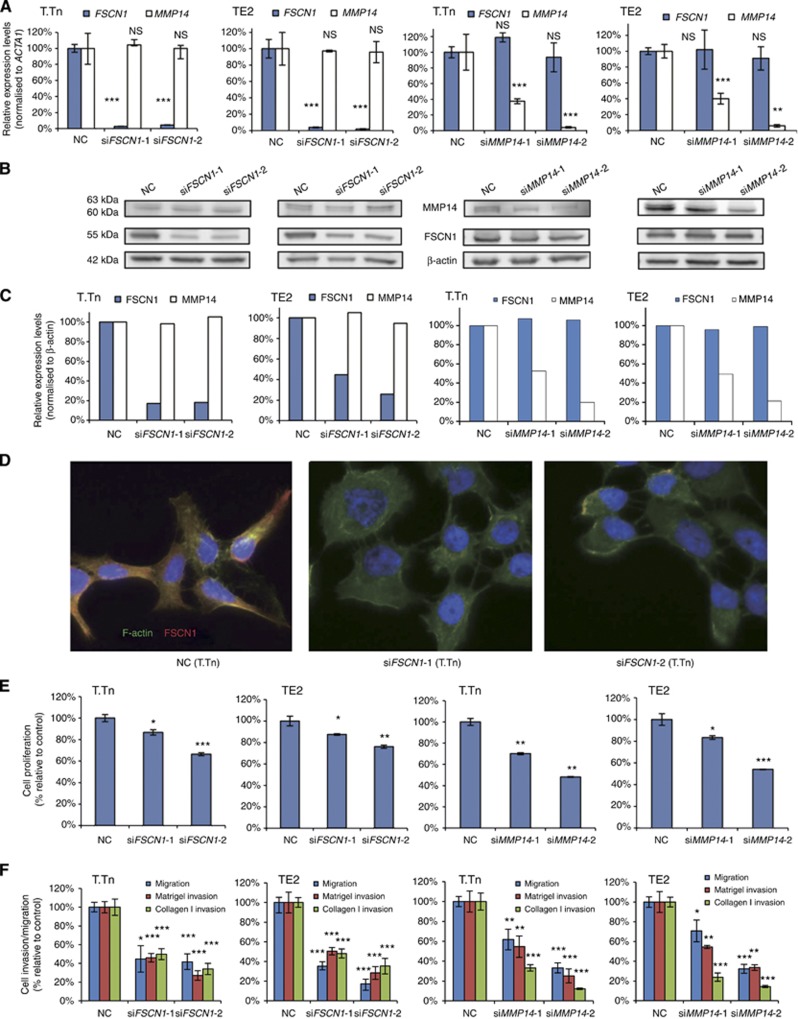
Figure 2.
The effects of FSCN1 and MMP14 knockdown on the mRNA levels, protein levels, morphological changes, proliferation and migration/invasion activities in ESCC cell lines 72 h after the transfection. Two siFSCN1, siFSCN1-1 and siFSCN1-2, and two siMMP14, siMMP14-1 and siMMP14-2, were transfected into ESCC cell lines (T.Tn and TE2 cells). (A) Results of the evaluation of the mRNA expression levels by real-time RT–PCR. (B and C) The results of an evaluation of the protein expression levels determined by a western blot analysis. The MMP14 protein was seen as two bands, 63 kDa for the latent form and 60 kDa for the active form. (D) Morphological changes of T.Tn cells. The cells were stained with an anti-FSCN1 antibody (red), phalloidin (green) and DAPI (blue). (E) Results of the proliferation assay. (F) Results of the migration/Matrigel invasion/collagen I invasion assay. Abbreviations: NC, negative control, NS, not significant. *P<0.05, **P<0.01, ***P<0.005. The full colour version of this figure is available at British Journal of Cancer online.

