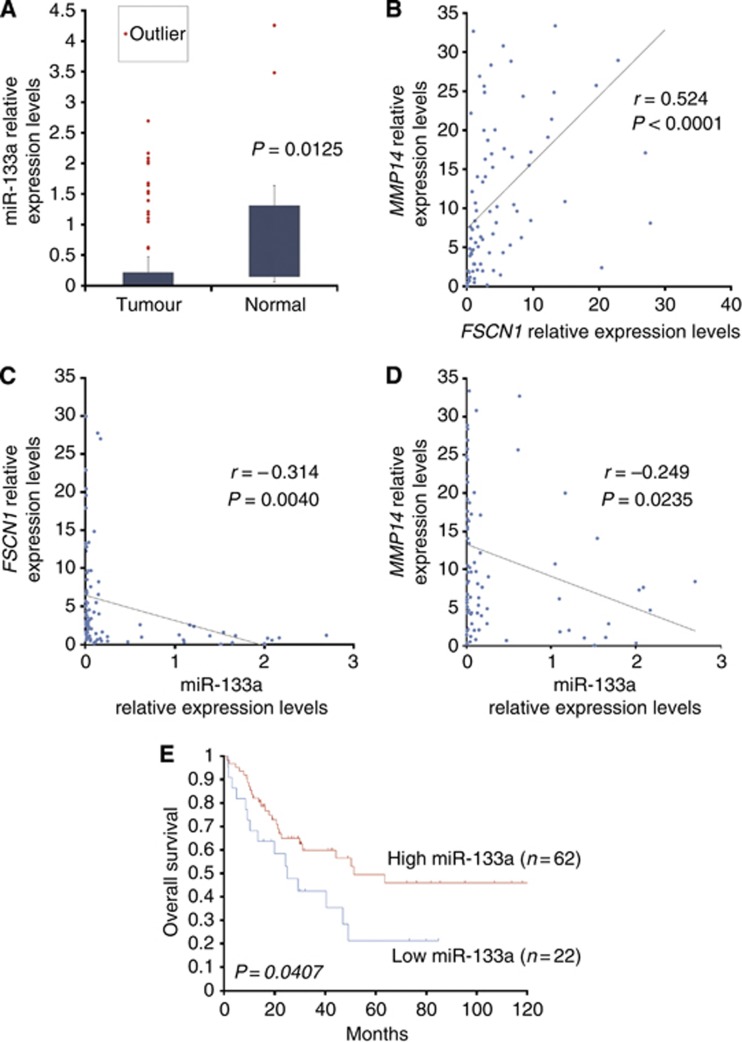
Figure 4.
The expression profiles of FSCN1 and MMP14 in 84 ESCC samples. (A) The expression levels of miR-133a in tumour tissues and normal tissues. (B) Correlation between FSCN1 and MMP14. (C) Correlation between miR-133a and FSCN1. (D) Correlation between miR-133a and MMP14. (E) Results of the Kaplan–Meier survival analysis of the OS in the high miR-133a group vs the low miR-133a group.

