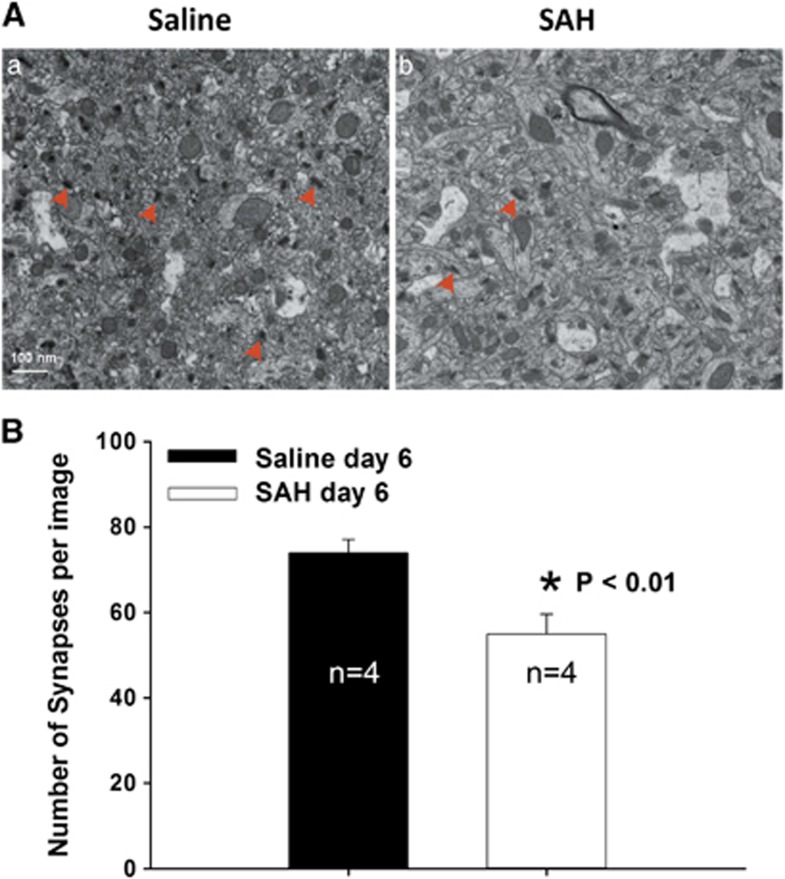
Figure 1.
Quantification of synapses using transmission electron microscopy (TEM). (A) Representative images of TEM showing synapses in CA1 area of the hippocampus (red arrow heads). (B) Bar graph showing significantly decreased number of synapses in subarachnoid hemorrhage (SAH) group as compared with saline controls (P⩽0.01, t-test). Data are mean±s.d. All animals were killed 6 days after surgery.

