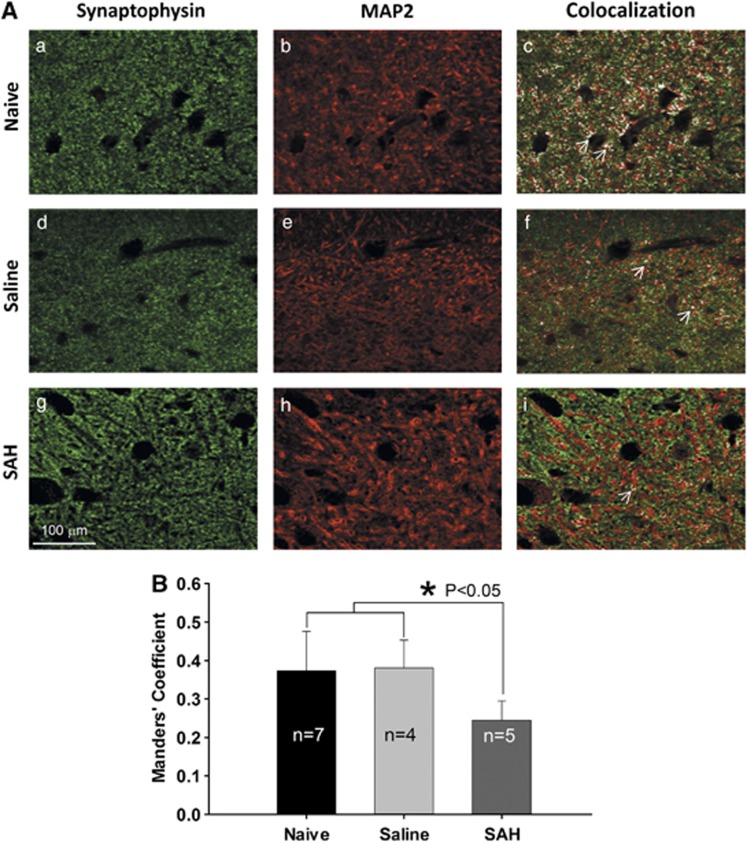
Figure 2.
Manders' coefficient analysis of active synapses in the hippocampus. (A) Representative images showing the colocalization of presynaptic marker synaptophysin and postsynaptic marker microtubule-associated protein 2 (MAP2) (white areas as indicated by white arrows in c, f, and i). Decreased colocalization (white area in images) is apparent in subarachnoid hemorrhage (SAH) group (i). (B) Subarachnoid hemorrhage induced a significant decrease of Manders' coefficient on the colocalization of synaptophysin/MAP2 (P⩽0.05, analysis of variance). Data are mean±s.d. All animals were killed 6 days after surgery.

