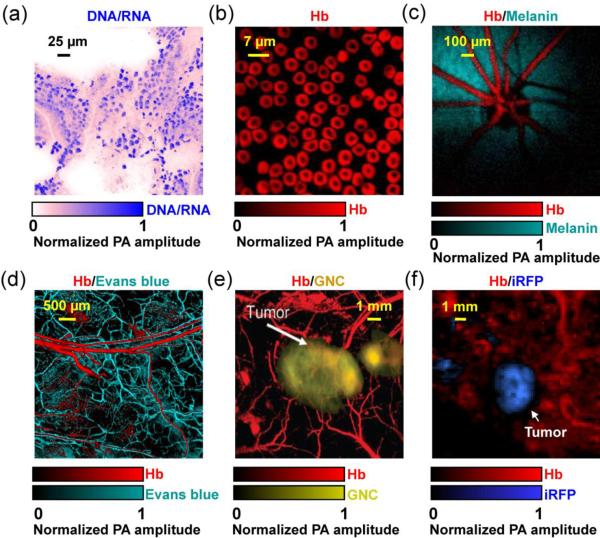
Figure 5.
Representative multi-contrast PAM images. (a) UV-PAM of cell nuclei (shown in blue) in a 6-μm-thick slice from mouse small intestine. No histology staining was needed here. The signals of cell nuclei come from DNA and RNA. Reprinted with permission from [39]. (b) SW-PAM of red blood cells (RBC). The signals of RBCs come from hemoglobin (Hb). Reprinted with permission from [35]. (c) Photoacoustic ophthalmoscopy of retinal vessels (shown in red) and the retinal pigment epithelium layer (RPE, shown in green) in a living rat. The signals of the RPE layer come from melanin. Reprinted with permission from [68]. (d) OR-PAM of the microvasculature in a mouse ear, where the capillaries (shown in green) were enhanced by Evans blue dye. Reprinted with permission from [101]. (e) AR-PAM of a subcutaneously inoculated B16 melanoma labeled with targeted gold nanocages (GNC, shown in yellow) and the surrounding vessels (shown in red) in a living mouse. Reprinted with permission from [112]. (f) PAMac of a mouse mammary gland tumor which expressed a near-infrared fluorescent protein iRFP (shown in blue). Reprinted with permission from [122].

