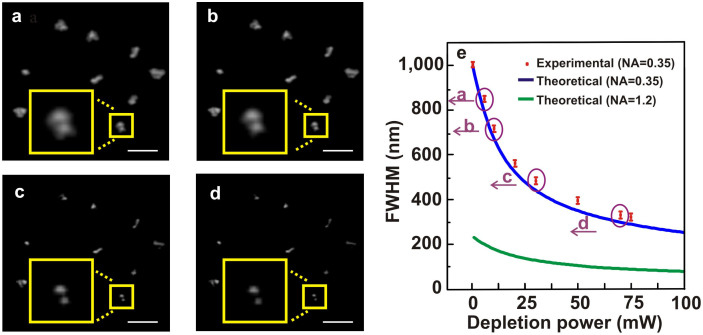
Figure 4. Break the diffraction-limited resolution barrier.
Fiber-optical STED two-photon endoscopic images of fluorescent microspheres at the power levels of 5 mW (a), 10 mW (b), 30 mW (c) and 70 mW (d), respectively. The insets are the enlarged images corresponding to the those in the yellow square. (e) The comparison of the measured and calculated FWHM values as a function of the depletion beam power for the bead images. The green curve represents the calculated FWHM values as a function of the depletion beam power for NA = 1.2 at a coverglass/water interface (n1/n2 = 1.515/1.33). The scale bars are 1.3 μm. The circled points in (e) correspond to the two-photon endoscopic images shown in (a)–(d).

