
Figure 3. Performance plot NARMA10 for a Mackey-Glass nonlinearity type with parameter settings: η = 0.5,  and p = 1.
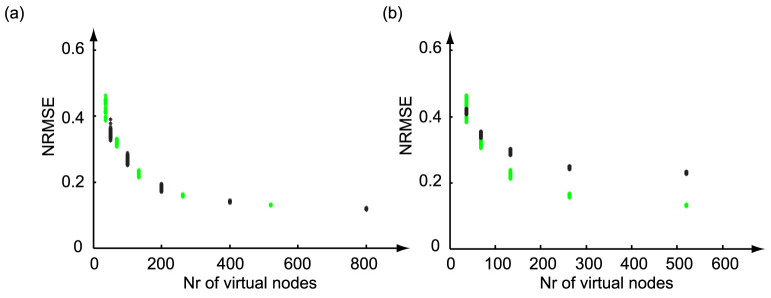
(a) Random and constructed optimal masks for θ = 0.2: the black points denote the scoring of the random masks, while the green points indicate the NRMSE obtained for constructed optimal masks. (b) Constructed optimal masks for different θ: the green points denote the scoring of the constructed optimal masks for θ = 0.2, while the black points indicate the NRMSE obtained for the same optimal masks for θ = 1. In both plots 100 masks were generated for every node number.