
Figure 4. Plot of the standard deviation on performance for NARMA10 with a Mackey-Glass nonlinearity type with parameter settings: η = 0.5,  , p = 1 and θ = 0.2.
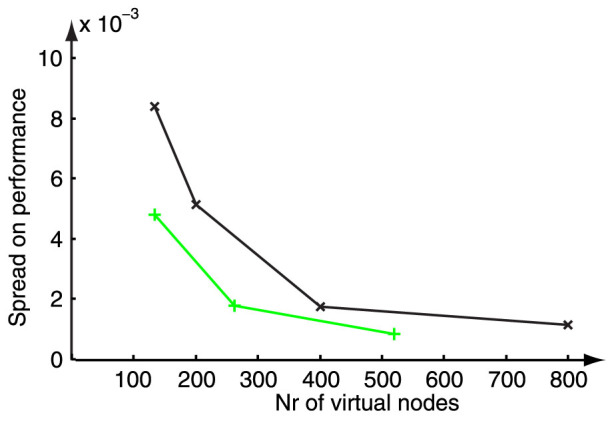
The black crosses denote the standard deviation on performance of the random masks, while the green plusses indicate the obtained standard deviation for constructed optimal masks. For every virtual node number 100 masks were generated.