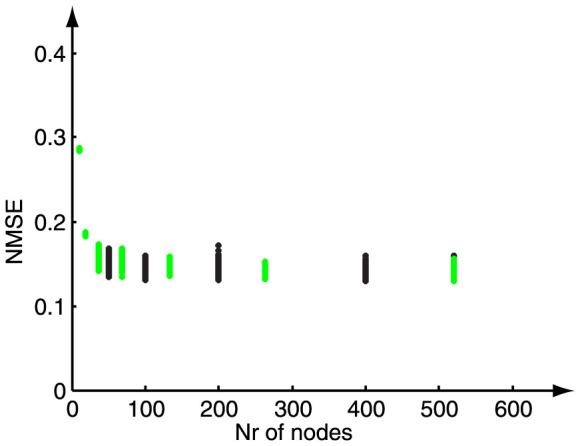
Figure 5. Performance plot for the Santa Fe laser prediction task for random and optimal masks.

A Mackey-Glass nonlinearity type is used, with parameter settings: η = 0.5,  , p = 1 and θ = 0.2. The black points denote the scoring of the random masks, while the green points indicate the NMSE obtained for optimal masks. For every scanned node number 100 masks were generated.
