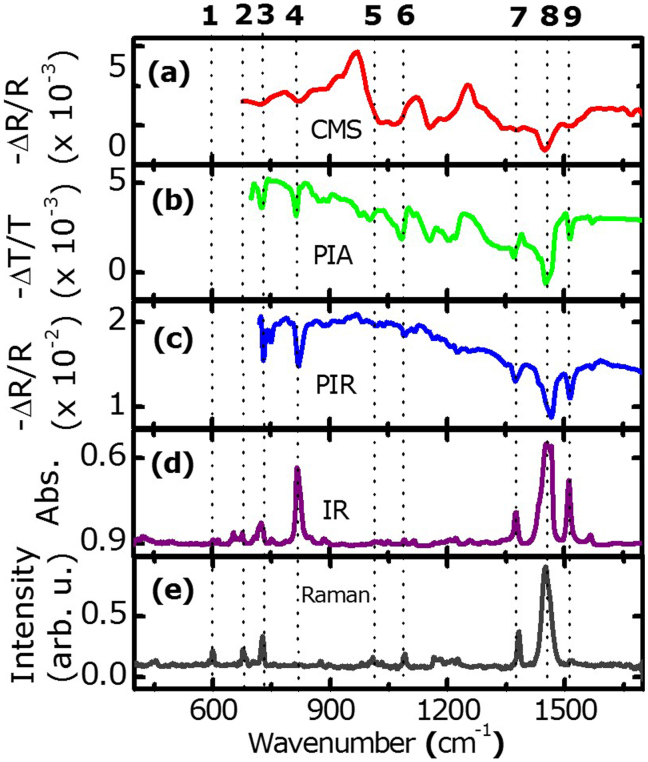
Figure 2. Comparison of IRAV modes with corresponding IR and Raman vibrational modes of P3HT.
(a) Electroinduced reflectance (CMS) spectrum acquired in ambient air condition with Von = −50 V, Voff = 25 V, and Vds = 0 V, and averaged 100 times. (b) Photoinduced absorption (PIA) and (c) photoinduced reflectance (PIR) spectra measured at 78 K (λex = 532 nm, I = 200 W/cm2). (d) Room temperature IR absorbance and (e) Raman (λex = 532 nm) spectra. The main vibrational modes are indicated by dashed lines; the numbers on top of panel (a) refer to their labelling in Table 1.

