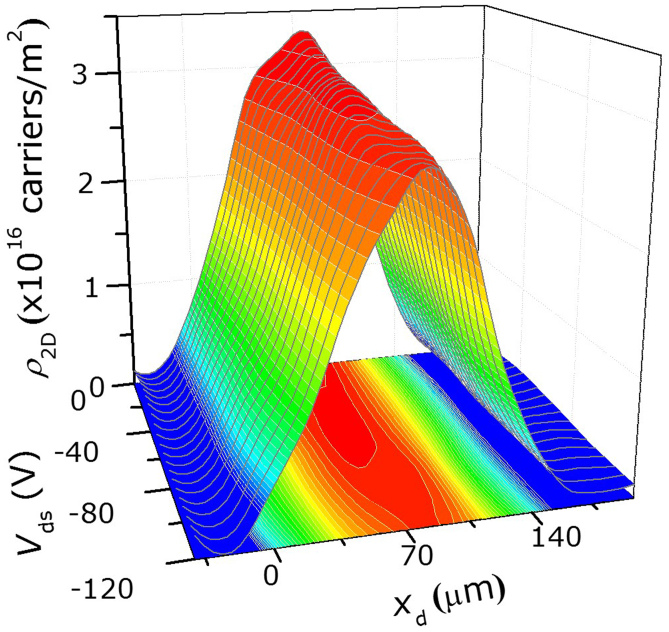
Figure 4. Three dimensional plot of the charge carrier density distribution across the channel of the polymer FET as a function of different applied source-drain voltage Vds (y-axis).
The charge carrier density ρ2D (z-axis) is obtained from analysis of the IR-CMS spectra. xd (x-axis) is the distance from the drain electrode. Measurements were obtained with gate modulation voltages of Von = −60 V and Voff = 80 V. Note the logarithmic color scale.

