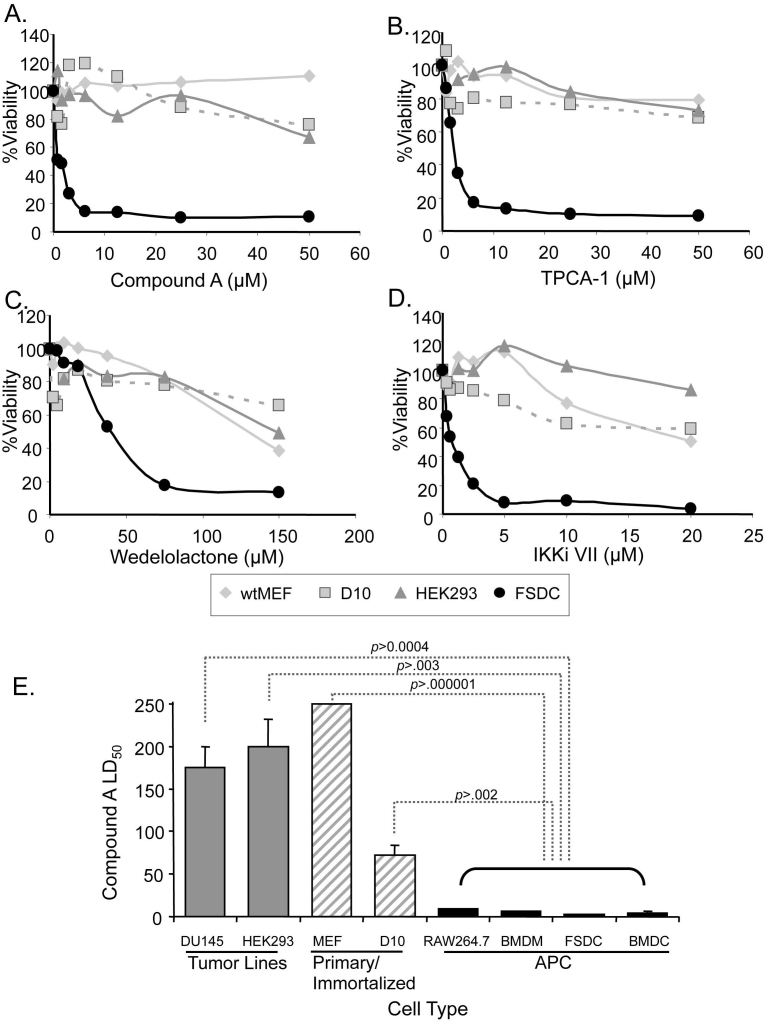
Figure 4. IKK inhibitor-induced cell death is APC-specific.
(A-D) Four cell lines, MEF, D10, HEK293, and FSDC, were evaluated for percent survival using a MTT assay in the presence of increasing doses of several IKK inhibitors. Each point was determined by averaging at least 3 measurements at the indicated concentrations of IKKβ-specific inhibitors, CmpA and TPCA-1 (A, B), or IKK complex inhibitors, Wedelolactone and IKKiVII (C,D), respectively. (E) LD50 values were determined for 4 APC and 4 non-APC cell lines in the presence of CmpA. Values were completed by regression analysis and LD50 was determined on a minimum of 3 survival curves for each cell line. p-values were determined by comparing each non-APC cell line with the least susceptible APC cell line (RAW264.7).

