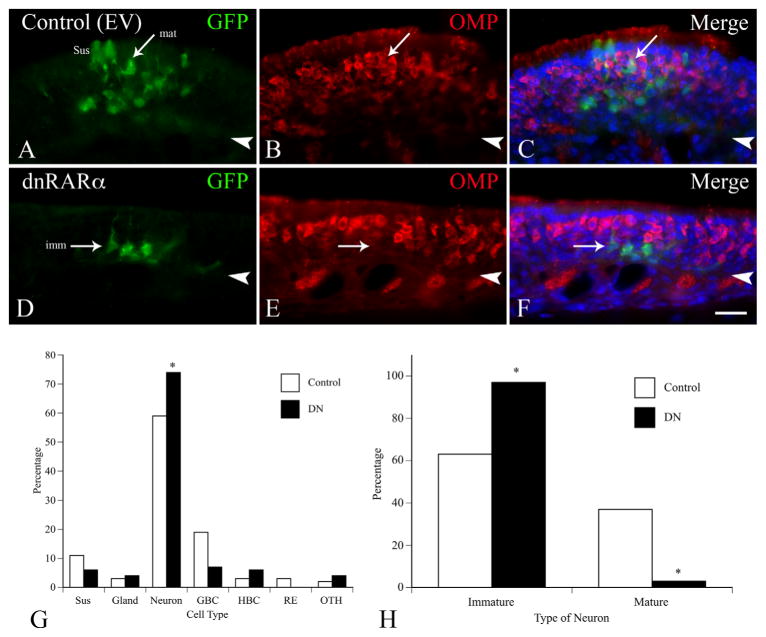
Figure 13.
Results of retroviral transduction in vivo 3 weeks after MeBr lesion and infection. A–C: Typical clone arising from transduction with control RV. GFP-labeled neurons are prominent in this clone, including some that stain for OMP (arrow labeled “mat” for mature). In C the staining for each of the antibodies is merged with Hoechst labeling of nuclei. D–F: Typical clone arising from transduction with RV encoding dnRARα403. Neurons are present, but they are limited to the deeper aspects of the epithelium and do not label with OMP (an example is marked by the arrow labeled “imm” for immature). G: Plot summarizing the cell distribution among the clones analyzed (control: 18 clones encompassing 154 cells; dnRARα403: 17 clones representing 139 cells). The dnRARα403 clones had a significantly higher percentage of neurons overall (74% vs. 59%, respectively, P = 0.01, chi-square analysis). H: Percentage of neurons that are mature vs. immature neurons in the clones. The clones transduced by dnRARα403-RV infection had a significantly lower percentage of mature neurons (3% vs. 37%, respectively, P < 0.001, chi-square analysis). Scale bar = 20 μm in F (also applies to A–E).

