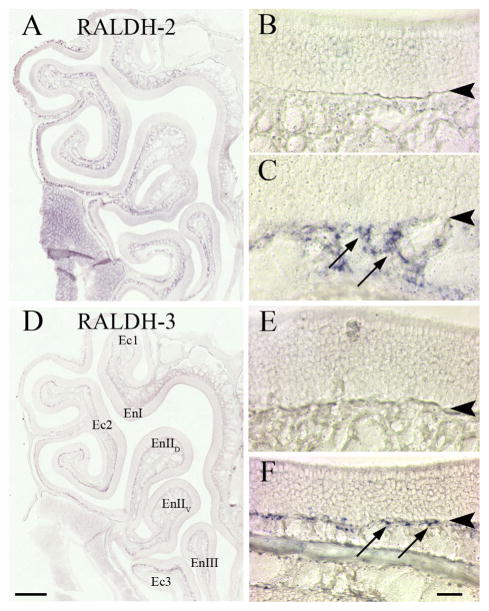
Figure 4.
The pattern of RALDH-2 and RALDH-3 mRNA expression matches the pattern of RALDH-2 and RALDH-3 IHC staining. ISH with DIG-labeled riboprobes designed against the full-length mRNA of the RALDH enzymes. A: Low-power view of the epithelium showing the general labeling pattern of RALDH-2, which fills the lamina propria in ventral mucosa, but is less prevalent in much of the dorsomedial mucosa and absent from the dorsal recess, in keeping with previously published results (Norlin et al., 2001). B,C: Higher-power view to illustrate the labeling pattern in the dorsomedial (B) vs. ventrolateral (C) mucosa. The arrows in C mark stained cells within the lamina propria. D: Low-power view of the mucosa showing the pattern of RALDH-3 ISH label, which is situated immediately deep to the basal lamina. E: High-power view of the dorsal recess. F: High-power view of ventrolateral mucosa to show that the labeling pattern of this gene matches the pattern seen with IHC. Once again, arrows are used in F to indicate stained cells. Note that for both RALDH-2 and RALDH-3 ISH label the staining is less extensive than the IHC pattern, which is likely to be the consequence of the lower sensitivity of ISH (cf. Fig. 1). Arrowheads indicate the basal lamina. Scale bars = 0.5 mm in A,D; = 20 μm in B,C,E,F.

