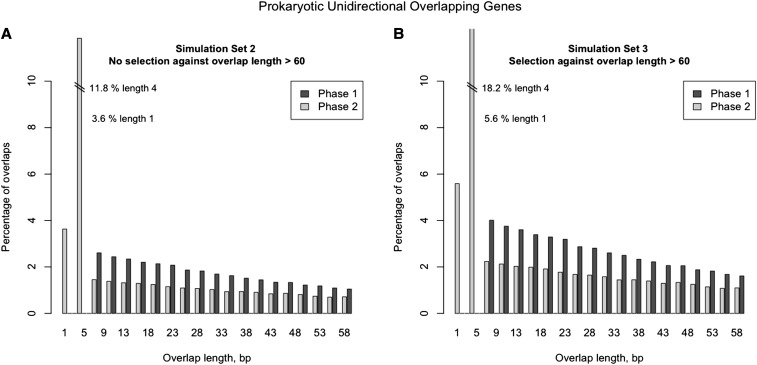
Figure 5.
Comparison of the unidirectional overlapping gene length distributions between simulated scenarios (scenario 2 vs. scenario 3) testing the effect of selection against very long overlaps (overlaps >60 bp). These simulations differ from the ones presented in Figure 4A. Gene sizes and intergenic distances were retrieved from the empirical distribution of prokaryotic genomes and no a posteriori weighting scheme was applied to the representativeness of phase 1 or phase 2. For practical reasons, gene sizes and intergenic distances were limited (50–1000 codons for gene size; 0–99 plus phase for intergenic distance). (A) Simulation scenario 2. Hypothetical prokaryotic overlap lengths of unidirectional adjacent genes calculated from simulated dataset (simulated parameters: GC content = 50%; criterion = Both; proportions of start codons = TRUE). No selection against overlap length >60 bp was included. Bar plot is limited to show only overlap length <60 bp. (B) Simulation scenario 3. Hypothetical prokaryotic overlap lengths of unidirectional adjacent genes calculated from simulated dataset (simulated parameters: GC content = 50%; criterion = Both; proportions of start codons = TRUE). Selection against overlap length >60 bp was included.

