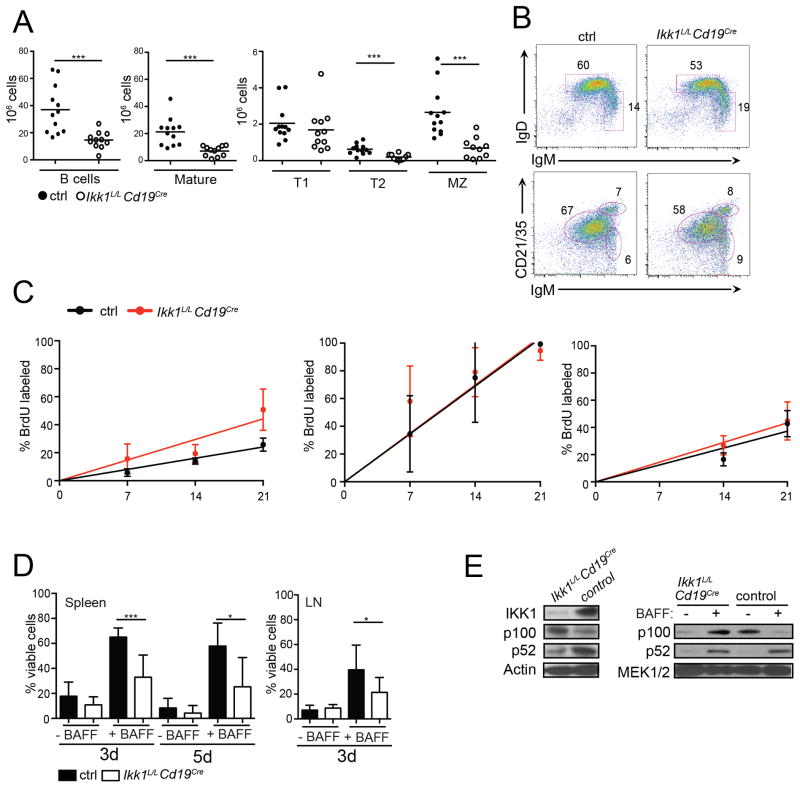
Figure 2. IKK1 deletion early in B cell development results in an incomplete block in B cell maturation.
(A) Graphs show total cell numbers of B cells (left panel) and B cell subsets (middle and right panel) in spleens obtained from Ikk1L/LCD19Cre+ and control mice. Ikk1L/LCD19Cre− or Ikk1+/+ CD19Cre+ mice were used as controls (ctrl). B cell subsets were identified by cell surface markers: B220+=total B cells, B220+CD21intIgMlow=mature B cells, B220+CD21lowIgMhi=T1 B cells, B220+CD21hiCD23hiIgMhi=T2 B cells, B220+CD21hiCD23int/low=MZ B cells. (B) B cell maturation in the spleen was analyzed by flow cytometry. Plots are representative of >11 mice analyzed. (C) Mice were continuously provided BrdU in the drinking water and euthanized after 7d, 14d or 21d of treatment. Cells were harvested from the spleen and the bone marrow and stained with an anti-BrdU antibody and for surface markers as follows: (left) splenic follicular (B220+, IgM+, CD23hi, CD21lo) B cells; (center) bone marrow B cell progenitors (B220+, IgM−, IgD−); (right) recirculating mature B cells (B220+, IgD+, IgMlo) in the bone marrow. Four experimental and CD19Cre control mice (10–15w old) were used per time point and rates of turnover calculated by linear regression analysis. (D) B cells from spleens enriched for mature B cells (CD23+CD43−), or from LNs (B220+CD43−) were stimulated with 10 ng/mL BAFF and the percentage of viable cells was determined by flow cytometry after 3 days and/or 5 days in culture. The graph summarizes n=7 samples for each genotype and time point. (E) Protein lysates from freshly-isolated splenic B cells were assayed for p100 cleavage by western blotting (left panel). p100 processing to p52 in LN B cells stimulated overnight with 25 ng/mL BAFF versus unstimulated cells (right panel).

