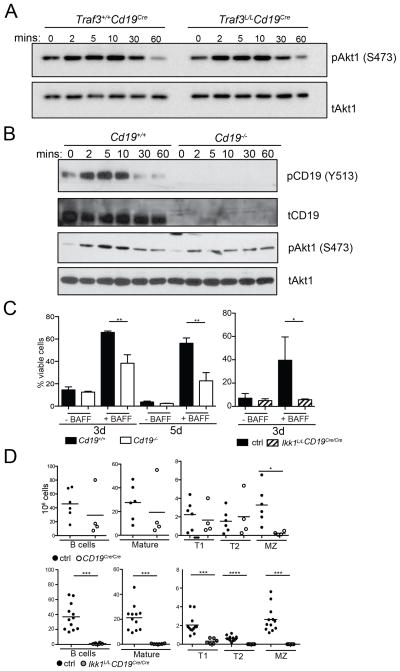
Figure 7. BAFF-induced signaling is attenuated in B cells lacking expression of CD19.
(A) Western blots of protein lysates from Traf3+/+Cd19Cre or Traf3L/LCd19Cre splenic B cells treated for indicated time points with BAFF were probed with anti-pAkt1 (S473) or anti-tAkt1 antibodies. (B) Western blots of protein lysates from Cd19+/+ or Cd19−/− splenic B cells treated for indicated time points with 25 ng/mL BAFF were probed with anti-pCD19 (Y513), anti-CD19, anti-pAkt1 (S473), or anti-tAkt1 antibodies. (C) Cd19+/+ or Cd19−/− LN B cells were left untreated or were cultured in the presence of 25ng/mL BAFF and the percentage of viable cells was determined by flow cytometry after 3 days and/or 5 days in culture (left panel). Graphs summarize data from 3 individual mice in technical triplicates per genotype. LN B cells from Ikk1L/LCD19Cre/Cre (IKK1 and CD19 double deficient) and control mice were treated with 10ng/mL BAFF or were cultured in medium alone and cell viability was assessed 3 days later (right panel). Graphs summarize results from 3 independent experiments with 7 control samples and 3 Ikk1L/LCD19Cre/Cre samples in total. These measurements were part of the experiments described in Figure 2C, therefore, results shown for Ikk1L/LCD19Cre/Cre samples can be directly compared with Ikk1L/LCD19Cre/+ samples shown in Figure 2C. (D) Total splenic B cells numbers and cell numbers of indicated B cell subsets from CD19−/− and control mice are shown in the top panel. B cell subsets were defined as in Figure 2A. Analysis of total cell numbers for Ikk1L/LCD19Cre/Cre and control mice is shown in the bottom panel. These mice were analyzed in parallel with mice presented in Figure 2A, therefore, results shown for Ikk1L/LCD19Cre/Cre mice can be directly compared with data from Ikk1L/LCD19Cre/+ mice shown in Figure 2A.

