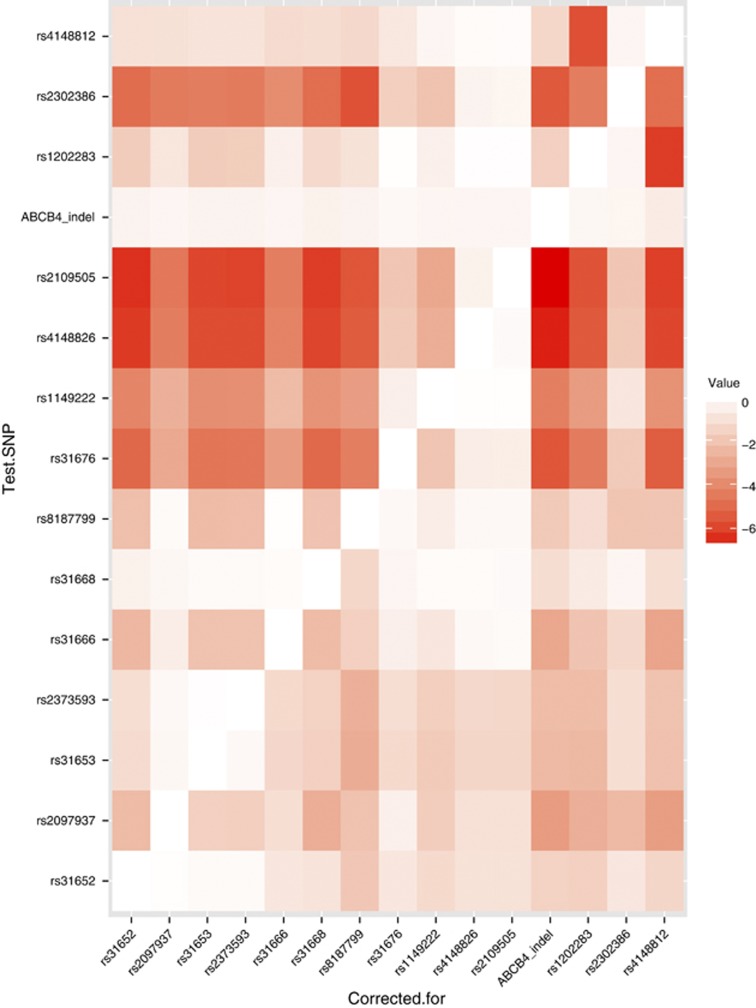
Figure 1.
Heat map showing conditional analysis of association signals at the ABCB4 locus. Each row plots the P value for the row single-nucleotide polymorphism (SNP), corrected for the column SNP, with color intensity indicating the size of the P value by order of magnitude units, hence 5 indicates a P value of <10−5. Thus, the map explores the independent effect of each SNP by removing the effects of each of the others in turn to determine if a single or multiple association signals are present.

