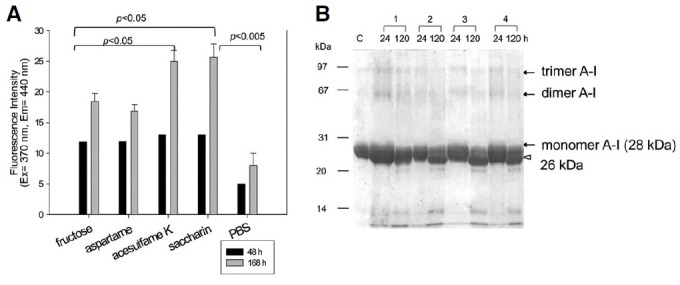
Fig. 1. Characterization of sweetener [fructose and artificial sweetener (AS)]-treated apoA-I by fluorescence and electro-phoresis. (A) Time-dependent fluorescence intensity of apoA-I after incubation with the sweetener (final concentration, 3 mM). The data shown represent the mean ± SD from three independent measurements. (B) Electrophoretic pattern of AStreated apoA-I at 24 and 120 h of incubation. Multimerized bands (indicated by arrow) were detected after 24 h, however, it largely disappeared and was cleaved to pro- duce 26 kDa (indicated by open arrow head) at 120 h. lane C, control apoA-I in native state; lane 1, fructose treated apoA-I; lane 2, aspartame treated apoA-I; lane 3, acesulfame K treated apoA-I; lane 4, saccharin treated apoA-I.

