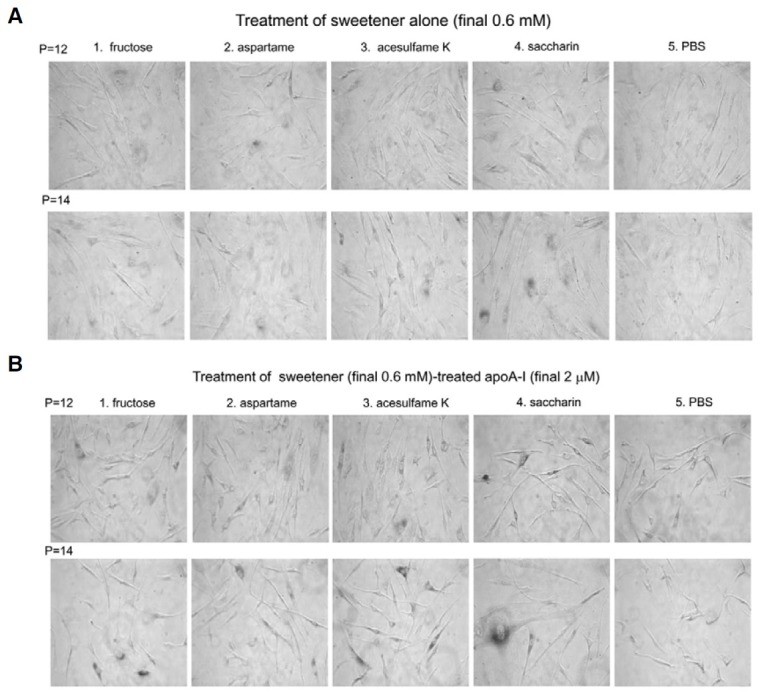
Fig. 8. Representative cell image was captured after treatment of sweetener alone [(A), final 0.6 mM of sweetener] or sweetener-treated apoAI [(B), final 0.6 mM of sweetener and 2 μM of apoA-I]. At the designated passage number, SA-β-gal activity (stained as blue color) was measured. The cell image was captured using a Nikon Eclipse TE2000 microscope (Japan) at 400× magnification.

