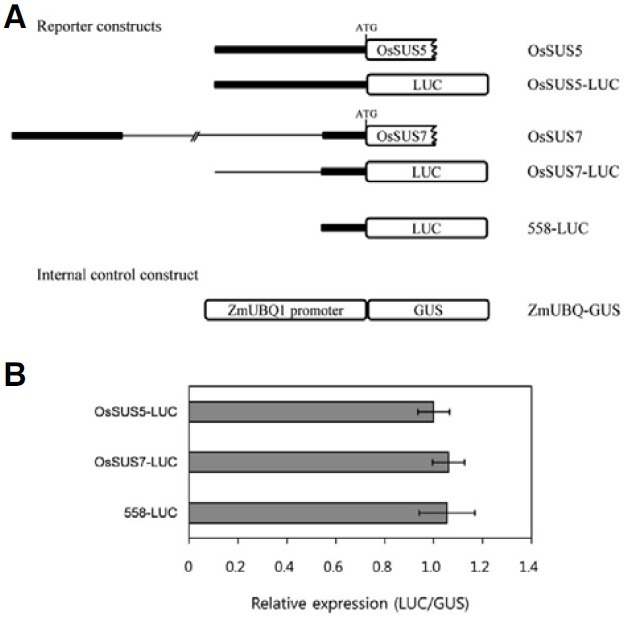
Fig. 5. Comparative expression analysis of the upstream regulatory regions of OsSUS5 and OsSUS7 using maize protoplasts. (A) Schematic diagram of the OsSUS5 and OsSUS7 genomic structure. Promoter regions are indicated by the thick line and the 17.6 kb region present in the promoter of OsSUS7 is highlighted by the thin line. Vectors used in transient expression experiments; OsSUS5- LUC, OsSUS7-LUC and 558-LUC. The ZmUBQ1-GUS construct was used as an internal control. (B) Transient expression assays of the three reporter constructs, OsSUS5-LUC, OsSUS7-LUC and 558-LUC, in maize mesophyll protoplasts. The bar indicates standard errors.